NGINX.COM
Web Server Load Balancing with NGINX Plus

Insights from the 2024 NGINX Cookbook: 4 Solutions to Today’s Top Application Delivery Problems

The 2024 edition of the NGINX Cookbook is here, and it’s packed full of new solutions to today’s most common application delivery problems. Since its initial release in 2004, NGINX has evolved beyond its web serving roots to become a versatile tool for load balancing, reverse proxying, and serving as an API gateway, including integration with Kubernetes through NGINX Ingress Controller and enhanced security features. To support these expanded NGINX deployments, the new version of the NGINX Cookbook offers over a hundred practical recipes for installing, configuring, securing, scaling, and troubleshooting your NGINX instances – invaluable whether you’re running NGINX Open Source on a smaller project or NGINX Plus in an enterprise environment. Keep reading for a quick look at sections of the Cookbook reflecting advancements in security and software load balancing.

Streamlining Service Communication with gRPC

Problem:

You need efficient communication between services, specifically the ability to terminate, inspect, route, or load balance gRPC method calls.

Solution:

Utilize NGINX as a proxy to terminate, inspect, route, and load balance gRPC method calls. This setup leverages HTTP/2’s capabilities for efficient communication while facilitating high performance and reliability of service interactions through effective load distribution and resiliency features like retries and circuit breaking.

Automating NGINX Provisioning in the Cloud

Problem:

To streamline deployments, you need to automate the provisioning and configuration of NGINX servers in cloud environments.

Solution:

Utilize tools like AWS EC2 UserData and Amazon Machine Images (AMIs) for AWS, or their equivalents in other cloud services, to automate the provisioning and configuration of NGINX servers.

Implementing HTTP Basic Authentication with NGINX

Problem:

You need to secure your application or content using HTTP basic authentication.

Solution:

Encrypt passwords using openssl and configure NGINX with auth_basic and auth_basic_user_file directives to require authentication. Ensure security by deploying over HTTPS.

Configuring NGINX Plus as a SAML Service Provider

Problem:

You want to enhance security by integrating NGINX Plus with a SAML identity provider (IdP) to safeguard resources through authentication.

Solution:

Set up NGINX Plus with the njs module and key-value store for SAML SP integration. Then configure SAML settings in NGINX Plus, adjust scripts and files for SP and IdP specifics.

Download the Cookbook for Free

Whether you’re just getting started with NGINX or an experienced user, this updated guide provides practical solutions to challenges you’ll likely face when deploying and scaling modern distributed applications. Empower yourself with the latest NGINX best practices and strategies. Download the free ebook today.

F5 NGINX Ingress Controller with Prometheus-operator for Out-of-the-Box Metrics

NGINX Ingress Controller from F5 NGINX combined with the Prometheus operator ServiceMonitor CRD makes gathering metrics from NGINX Ingress Controller deployments much easier and much faster using Helm.

The NGINX Ingress Controller helm chart now supports the ability to immediately take advantage of your existing Prometheus and prometheus-operator infrastructure, allowing you to deploy NIC and have metrics out of the box leveraging Prometheus ServiceMonitor.

This article walks you through what ServiceMonitor is, how you can install it, and how you can use the NGINX Ingress Controller helm chart to define these specific settings.

Prometheus ServiceMonitor

The Prometheus ServiceMonitor custom resource definition (CRD) allows you to declaratively define how a dynamic set of services should be monitored. The services monitored are defined using Kubernetes label selectors. This allows an organization to introduce conventions governing how metrics are exposed. Following these conventions, new services are automatically discovered, and Prometheus begins gathering metrics without the need to reconfigure the system.

ServiceMonitor is part of the Prometheus Operator. These resources describe and manage monitoring targets to be scraped by Prometheus. The Prometheus resource connects to ServiceMonitor using a ServiceMonitor Selector field. Prometheus can easily identify what targets have been marked for scraping. This gives you more control and flexibility to leverage ServiceMonitor resources in your Kubernetes cluster to monitor solutions like NGINX Ingress Controller.

To make things easier and provide out-of-the-box metrics for NGINX Ingress Controller, we recently added the ability to use Prometheus ServiceMonitor to our helm chart. This makes it quite easy to enable metrics for Prometheus to begin scraping right after deploying NGINX Ingress Controller.

To use this feature, we need to add a second service specifically created for metrics collection that ServiceMonitor will “attach” to. This will tell the Prometheus operator what service it should monitor (using the labels in the metadata) so it knows what and where to scrape.

Example of what a service for NGINX Ingress Controller would look like if part of deployment or helm files:


apiVersion: v1
kind: Service
metadata:
  name: nginx-ingress-servicemonitor
  labels:
    app: nginx-ingress-servicemonitor
spec:
  ports:
  - name: prometheus
    protocol: TCP
    port: 9113
    targetPort: 9113
  selector:
    app: nginx-ingress

The above will be part of the deployment. The label, app: nginx-ingress-servicemonitor “connects” to the serviceMonitor for Prometheus metric scraping.

Below is a sample serviceMonitor that would link to the above service named nginx-ingress-servicemonitor:


apiVersion: monitoring.coreos.com/v1
kind: ServiceMonitor
metadata:
  name: nginx-ingress-servicemonitor
  labels:
    app: nginx-ingress-servicemonitor
spec:
  selector:
    matchLabels:
      app: nginx-ingress-servicemonitor
  endpoints:
  - port: prometheus

It is necessary to create a Prometheus resource, which is configured to look for the serviceMonitor resources, allowing Prometheus to quickly and easily know what endpoints to scrape for metrics.

In our example below, this resource tells Prometheus what items to monitor under the spec. In the below, we are monitoring spec.serviceMonitorSelector.matchLabels:. We can see that Prometheus is looking for matchLabels with app.nginx-ingress-servicemonitor in any namespace. This matches the serviceMonitor resource that will be deployed by the NGINX Ingress Controller helm charts and Helm.


apiVersion: monitoring.coreos.com/v1
kind: Prometheus
metadata:
  name: prometheus
  labels:
    prometheus: prometheus
spec:
  replicas: 1
  serviceAccountName: prometheus
  serviceMonitorNamespaceSelector:  {}
  serviceMonitorSelector:
    matchLabels:
      app: nginx-ingress-servicemonitor
  resources:
    requests:
      memory: 500Mi

Here is a diagram the connects the different pieces:

ServiceMonitor diagram
Figure 1: service-monitor object relationship

Installing Prometheus, prometheus-operator and Grafana

We are going to use the prometheus-community/kube-prometheus-stack to install the full deployment. This will install prometheus, prometheus-operator and Grafana. We are also going to specify we want to install this in the monitoring namespace for isolation.

Here is how we can install with helm:

helm install metrics01 prometheus-community/kube-prometheus-stack -n monitoring --create-namespace

Create and install Prometheus resource

Once Prometheus and the Prometheus CRDs are installed into the cluster, we can create our Prometheus resource. By deploying this ahead of time, we can “pre-plumb” our Prometheus setup with the labels we will use in the helm chart. With this approach, we can automatically have Prometheus start to look for NGINX Ingress Controller and scrape for metrics.

Our Prometheus resource will be deployed prior to installing NGINX Ingress Controller. This will allow the prometheus-operator to automatically pick up and scrape our NGINX Ingress controller after deployment, providing metrics quickly.


apiVersion: monitoring.coreos.com/v1
kind: Prometheus
metadata:
  name: prometheus
  namespace: default
  labels:
    prometheus: monitoring
spec:
  replicas: 1
  serviceAccountName: prometheus
  serviceMonitorNamespaceSelector:  {}
  serviceMonitorSelector:
    matchLabels:
      app: nginx-ingress-servicemonitor
  resources:
    requests:
      memory: 500Mi

Our example above is a basic example. The key part is the spec.serviceMonitorSelector.matchLabels value we specified. This value is what we are going to use when we deploy NGINX Ingress controller with the helm chart.

We want to provide Prometheus metrics out of the box. To do so, we are going to use NGINX Ingress Controller helm chart.

NGINX Ingress Controller helm values.yaml changes

We can review the values.yaml file for the helm chart. There is a Prometheus section we want to focus on as it has the required pieces needed to enable Prometheus, create the required service, and create a serviceMonitor resource.

Under the Prometheus section, we should see several settings:

prometheus.service
prometheus.serviceMonitor

We are going to enable both of the above settings, to generate the required service and serviceMonitor when using the helm chart.

Here is the specific section where we enable the service, enable serviceMonitor, and define the labels in the serviceMonitor section:


`servicemonitor` support was recently added to the NGINX Ingress controller helm chart. 
prometheus:
  ## Expose NGINX or NGINX Plus metrics in the Prometheus format.
  create: true

  ## Configures the port to scrape the metrics.
  port: 9113

  secret: ""

  ## Configures the HTTP scheme used.
  scheme: http

  service:
    ## Requires prometheus.create=true
    create: true

  serviceMonitor:
    create: true
    labels: { app: nginx-ingress-servicemonitor } 

Breaking out the values from the above:


prometheus:
  ## Expose NGINX or NGINX Plus metrics in the Prometheus format.
  create: true

Tells Helm you want to enable the NIC Prometheus endpoint. You can additionally define a port, scheme, and secret if required.

By setting the value of prometheus.service.create to true, Helm will automatically create the NIC ServiceMonitor service.


service:
    ## Creates a ClusterIP Service to expose Prometheus metrics internally
    ## Requires prometheus.create=true
    create: true

Lastly, we need to create the serviceMonitor. Setting this to true and adding the correct labels will create and add the labels that match our Prometheus resource.


serviceMonitor:
    ## Creates a serviceMonitor to expose statistics on the kubernetes pods.
    create: true
    ## Kubernetes object labels to attach to the serviceMonitor object.
    labels: { app: nginx-ingress-servicemonitor } 

The label links back to the name of the service.labels: { app: nginx-ingress-servicemointor }

To Summarize. Enable Prometheus, this exposes the Prometheus exporter capability of NIC. Define a Service object, this is how the Prometheus ServiceMonitor discovers NIC Prometheus exporter endpoints. Define a serviceMonitor object. This tells Prometheus ServiceMonitor to monitor this thing.

Now we can install NGINX Ingress Controller with helm.

Once we have modified our values.yaml, we can then proceed to install NGINX Ingress controller.

helm install nic01 -n nginx-ingress --create-namespace -f values.yaml .

After we deploy NGINX Ingress Controller, we can open up the Prometheus dashboard and navigate to status menu. From there we can navigate to the targets and service discovery views. Once Prometheus locates our new ServiceMonitor resource, it will begin to scrape the endpoint and collect metrics which are immediately picked up in the Prometheus dashboard.

Prometheus service discovery
Figure 2: Prometheus service discovery
Prometheus target
Figure 3: Prometheus target
Prometheus NGINX Query
Figure 4: Prometheus NGINX Query

We can see that using native Kubernetes tools like helm and Prometheus, NGINX Ingress Controller can make collecting metrics at the start of deployment a lot easier, providing “out of the box metrics”.

Here are reference documents to installing prometheus-operator:

https://prometheus-operator.dev/
https://github.com/prometheus-operator/prometheus-operator

Announcing NGINX Gateway Fabric Release 1.2.0

We are thrilled to share the latest news on NGINX Gateway Fabric, which is our conformant implementation of the Kubernetes Gateway API. We recently updated it to version 1.2.0, with several exciting new features and improvements. This release focuses on enhancing the platform’s capabilities and ensuring it meets our users’ demands. We have included F5 NGINX Plus support and expanded our API surface to cover the most demanded use cases. We believe these enhancements will create a better experience for all our users and help them achieve their goals more efficiently.

NGINX Gateway Fabric’s design and architecture overview

Figure 1: NGINX Gateway Fabric’s design and architecture overview


NGINX Gateway Fabric 1.2.0 at a glance:

  • NGINX Plus Support – NGINX Gateway Fabric now supports NGINX Plus for the data plane, which offers improved availability, detailed metrics, and real-time observability dashboards.
  • BackendTLSPolicy – TLS verification allows NGINX Gateway Fabric to confirm the identity of the backend application, protecting against potential hijacking of the connection by malicious applications. Additionally, TLS encrypts traffic within the cluster, ensuring secure communication between the client and the backend application.
  • URLRewrite – NGINX Gateway Fabric now supports URL rewrites in Route objects. With this feature, you can easily modify the original request URL and redirect it to a more appropriate destination. That way, as your backend applications undergo API changes, you can keep the APIs you expose to your clients consistent.
  • Product Telemetry – With product telemetry now present in NGINX Gateway Fabric, we can help further improve operational efficiency of your infrastructure by learning about how you use the product in your environment. Also, we are planning to share these insights regularly with the community during our meetings.

We’ll take a deeper look at the new features below.

What’s New in NGINX Gateway Fabric 1.2.0?

NGINX Plus Support

NGINX Gateway Fabric version 1.2.0 has been released with support for NGINX Plus, providing users with many new benefits. With the new upgrade, users can now leverage the advanced features of NGINX Plus in their deployments including additional Prometheus metrics, dynamic upstream reloads, and the NGINX Plus dashboard.

This upgrade also allows you the option to get support directly from NGINX for your environment.

Additional Prometheus Metrics

While using NGINX Plus as your data plane, additional advanced metrics will be exported alongside the metrics you would normally get with NGINX Open Source. Some highlights include metrics around http requests, streams, connections, and many more. For the full list, you can check NGINX’s Prometheus exporter for a convenient list, but note that the exporter is not strictly required for NGINX Gateway Fabric.

With any installation of Prometheus or Prometheus compatible scraper, you can scrape these metrics into your observability stack and build dashboards and alerts using one consistent layer within your architecture. Prometheus metrics are automatically available in the NGINX Gateway Fabric through HTTP Port 9113. You can also change the default port by updating the Pod template.

If you are looking for a simple setup, you can visit our GitHub page for more information on how to deploy and configure Prometheus to start collecting. Alternatively, if you are just looking to view the metrics and skip the setup, you can use the NGINX Plus dashboard, explained in the next section.

After installing Prometheus in your cluster, you can access its dashboard by running port-forwarding in the background.

kubectl -n monitoring port-forward svc/prometheus-server 9090:80

Prometheus Graph with NGINX Gateway Fabric connections accepted

Figure 2: Prometheus Graph showing NGINX Gateway Fabric connections accepted

The above setup will work even if you are using the default NGINX Open Source as your data plane as well! However, you will not see any of the additional metrics that NGINX Plus provides. As the size and scope of your cluster grows, we recommend looking at how NGINX Plus metrics can help quickly resolve your capacity planning issues, incidents, and even backend application faults.

Dynamic Upstream Reloads

Dynamic upstream reloads, enabled by NGINX Gateway Fabric automatically when installed with NGINX Plus, allow NGINX Gateway Fabric to make updates to NGINX configurations without a NGINX reload.

Traditionally, when a NGINX reload occurs, the existing connections are handled by the old worker processes while the newly configured workers handle new ones. When all the old connections are complete, the old workers are stopped, and NGINX continues with only the newly configured workers. In this way, configuration changes are handled gracefully even in NGINX Open Source.

However, when NGINX is under high load, maintaining both old and new workers can create a resource overhead that may cause problems, especially if trying to run NGINX Gateway Fabric as lean as possible. The dynamic upstream reloads featured in NGINX Plus bypass this problem by providing an API endpoint for configuration changes that NGINX Gateway Fabric will use automatically if present, reducing the need for extra resource overhead to handle old and new workers during the reload process.

As you begin to make changes more often to NGINX Gateway Fabric, reloads will occur more frequently. If you are curious how often or when reloads occur in your current installation of NGF, you can look at the Prometheus metric nginx_gateway_fabric_nginx_reloads_total. For a full, deep dive into the problem, check out Nick Shadrin’s article here!

Here’s an example of the metric in an environment with two deployments of NGINX Gateway Fabric in the Prometheus dashboard:

Prometheus graph with the NGINX Gateway Fabric reloads total

Figure 3: Prometheus graph showing the NGINX Gateway Fabric reloads total

NGINX Plus Dashboard

As previously mentioned, if you are looking for a quick way to view NGINX Plus metrics without a Prometheus installation or observability stack, the NGINX Plus dashboard gives you real-time monitoring of performance metrics you can use to troubleshoot incidents and keep an eye on resource capacity.

The dashboard gives you different views for all metrics NGINX Plus provides right away and is easily accessible on an internal port. If you would like to take a quick look for yourself as to what the dashboard capabilities look like, check out our dashboard demo site at demo.nginx.com.

To access the NGINX Plus dashboard on your NGINX Gateway Fabric installation, you can forward connections to Port 8765 on your local machine via port forwarding:

kubectl port-forward -n nginx-gateway 8765:8765

Next, open your preferred browser and type http://localhost:8765/dashboard.html in the address bar.

NGINX Plus Dashboard

Figure 4: NGINX Plus Dashboard overview

BackendTLSPolicy

This release now comes with the much-awaited support for the BackendTLSPolicy. The BackendTLSPolicy introduces encrypted TLS communication between NGINX Gateway Fabric and the application, greatly enhancing the communication channel’s security. Here’s an example that shows how to apply the policy by specifying settings such as TLS ciphers and protocols when validating server certificates against a trusted certificate authority (CA).

The BackendTLSPolicy enables users to secure their traffic between NGF and their backends. You can also set the minimum TLS version and cipher suites. This protects against malicious applications hijacking the connection and encrypts the traffic within the cluster.

To configure backend TLS termination, first create a ConfigMap with the CA certification you want to use. For help with managing internal Kubernetes certificates, check out this guide.


kind: ConfigMap
apiVersion: v1
metadata:
  name: backend-cert
data:
  ca.crt: 
         < -----BEGIN CERTIFICATE-----
	   -----END CERTIFICATE-----
          >

Next, we create the BackendTLSPolicy, which targets our secure-app Service and refers to the ConfigMap created in the previous step:


apiVersion: gateway.networking.k8s.io/v1alpha2
kind: BackendTLSPolicy
metadata:
  name: backend-tls
spec:
  targetRef:
    group: ''
    kind: Service
    name: secure-app
    namespace: default
  tls:
    caCertRefs:
    - name: backend-cert
      group: ''
      kind: ConfigMap
    hostname: secure-app.example.com

URLRewrite

With a URLRewrite filter, you can modify the original URL of an incoming request and redirect it to a different URL with zero performance impact. This is particularly useful when your backend applications change their exposed API, but you want to maintain backwards compatibility for your existing clients. You can also use this feature to expose a consistent API URL to your clients while redirecting the requests to different applications with different API URLs, providing an “experience” API that combines the functionality of several different APIs for your clients’ convenience and performance.

To get started, let’s create a gateway for the NGINX gateway fabric. This will enable us to define HTTP listeners and configure the Port 80 for optimal performance.


apiVersion: gateway.networking.k8s.io/v1
kind: Gateway
metadata:
  name: cafe
spec:
  gatewayClassName: nginx
  listeners:
  - name: http
    port: 80
    protocol: HTTP

Let’s create an HTTPRoute resource and configure request filters to rewrite any requests for /coffee to /beans. We can also provide a /latte endpoint that is rewritten to include the /latte prefix for the backend to handle (“/latte/126” becomes “/126”).


apiVersion: gateway.networking.k8s.io/v1
kind: HTTPRoute
metadata:
  name: coffee
spec:
  parentRefs:
  - name: cafe
    sectionName: http
  hostnames:
  - "cafe.example.com"
  rules:
  - matches:
    - path:
        type: PathPrefix
        value: /coffee
    filters:
    - type: URLRewrite
      urlRewrite:
        path:
          type: ReplaceFullPath
          replaceFullPath: /beans
    backendRefs:
    - name: coffee
      port: 80
  - matches:
    - path:
        type: PathPrefix
        value: /latte
    filters:
    - type: URLRewrite
      urlRewrite:
        path:
          type: ReplacePrefixMatch
          replacePrefixMatch: /
    backendRefs:
    - name: coffee
      port: 80

The HTTP rewrite feature helps ensure flexibility between the endpoints on the client side and how they are mapped with the backend. It also allows traffic redirection from one URL to another, which is particularly helpful when migrating content to a new website or API traffic.

Although NGINX Gateway Fabric supports path-based rewrites, it currently does not support path-based redirects. Let us know if this is a feature you need for your environment.

Product Telemetry

We have decided to include product telemetry as a mechanism to passively collect feedback as a part of the 1.2 release. This feature will collect a variety of metrics from your environment and send them to our data collection platform every 24 hours. No PII is collected, and you can see the full list of what is collected here.

We are committed to providing complete transparency around our telemetry functionality. While we will document every field we collect, and you can validate what we collect by our code, you always have the option to disable it completely. We are planning to regularly review interesting observations based on the statistics we collect with the community in our community meetings, so make sure to drop by!

Resources

For the complete changelog for NGINX Gateway Fabric 1.2.0, see the Release Notes. To try NGINX Gateway Fabric for Kubernetes with NGINX Plus, start your free 30-day trial today or contact us to discuss your use cases.

If you would like to get involved, see what is coming next, or see the source code for NGINX Gateway Fabric, check out our repository on GitHub!

We have bi-weekly community meetings on Mondays at 9AM Pacific/5PM GMT. The meeting link, updates, agenda, and notes are on the NGINX Gateway Fabric Meeting Calendar. Links are also always available from our GitHub readme.

Our Design Vision for NGINX One: The Ultimate Data Plane SaaS

A Deeper Dive into F5 NGINX One, and an Invitation to Participate in Early Access

A few weeks ago, we introduced NGINX One to our customers at AppWorld 2024. We also opened NGINX One Early Access, and a waiting list is now building. The solution is also being featured at AppWorld EMEA and AppWorld Asia Pacific. Events throughout both regions will continue through June.

So the timing seems appropriate, in the midst of all this in-person activity, to share a bit more of our thinking and planning for NGINX One with our blog readers and re-extend that early access invitation to our global NGINX community.

Taking NGINX to Greater Heights

At the heart of all NGINX products lies our remarkable data plane. Designed and coded originally by Igor Sysoev, the NGINX data plane has stood the test of time. It is remarkably self-contained and performant. The code base has remained small and compact, with few dependencies and rare security issues. Our challenge was to make the data plane the center of a broader, complete product offering encompassing everything we build — and make that data plane more extensible, accessible, affordable, and manageable.

We also wanted to make NGINX a more accessible option for our large base of F5 customers. These are global teams for enterprise-wide network operations and security, many of which are responsible for NGINX deployments and ensuring that application development and platform ops teams get what they need to build modern applications.

Core Principles: No Silos, Consumption-Based, One Management Plane, Global Presence

With all this in mind, when we started planning NGINX One, we laid out a handful of design conventions that we wanted to follow:

  • Non-opinionated and flexible — NGINX One will be easy to implement across the entire range of NGINX use cases (web server, reverse proxy, application delivery, Kubernetes/microservices, application security, CDN).
  • Simple API interface — NGINX One will be easy to connect to any existing developer toolchain, platform, or system via RESTful APIs.
  • A single management system — NGINX One will provide one console and one management plane to run and configure everything NGINX. The console will be delivered ”as-a-service” with zero installation required and easy extensibility to other systems, such as Prometheus.
  • Consumption-based — With NGINX One, users will pay only for what they consume, substantially reducing barriers to entry and lowering overall cost of ownership.
  • Scales quickly, easily, and affordably in any cloud environment — NGINX One will be cloud and environment agnostic, delivering data plane, app delivery, and security capabilities on any cloud, any PaaS or orchestration engine, and for function-based and serverless environments.
  • Simplified security — NGINX One will make securing your applications in any environment easier to implement and manage, utilizing NGINX App Protect capabilities such as OneWAF and DDoS protection.
  • Intelligence for optimizing configurations — NGINX One will leverage all of NGINX’s global intelligence to offer intelligent suggestions on configuring your data plane, reducing errors, and increasing application performance.
  • Extensibility — NGINX One will be easy to integrate with other platforms for networking, observability and security, and application delivery. NGINX One will simplify integration with F5 Big-IP and other products, making it easier for network operations and security operations teams to secure and manage their technology estate across our product families.

NGINX One Is Designed to Be the Ultimate Data Plane Multi-Tool

We wanted to deliver all this while leveraging our core asset — the NGINX data plane. In fact, foundational to our early thinking on NGINX One was an acknowledgment that we needed to return to our data plane roots and make that the center of our universe.

NGINX One takes the core NGINX data plane software you’re familiar with and enhances it with SaaS-based tools for observability, management, and security. Whether you’re working on small-scale deployments or large, complex systems, NGINX One integrates seamlessly. You can use it as a drop-in replacement for any existing NGINX product.

For those of you navigating hybrid and multicloud environments, NGINX One simplifies the process. Integrating into your existing systems, CI/CD workflows, and cloud services is straightforward. NGINX One can be deployed in minutes and is consumable via API, giving you the flexibility to scale as needed. This service includes all essential NGINX products: NGINX Plus, NGINX Open Source, NGINX Instance Manager, NGINX Ingress Controller, and NGINX Gateway Fabric. NGINX One itself is hosted across multiple clouds for resilience.

In a nutshell, NGINX One can unify all your NGINX products into a single management sphere. Most importantly, with NGINX One you pay only for what you use. There are no annual license charges or per-seat costs. For startups, a generous free tier will allow you to scale and grow without fear of getting whacked with “gotcha” pricing. You can provision precisely what you need when you need it. You can dial it up and down as needed and automate scaling to ensure your apps are always performant.

NGINX One + F5 Big-IP = One Management Plane and Global Presence

To make NGINX easier to manage as part of F5 products, NGINX One better integrates with F5 while leveraging F5’s global infrastructure. To start with, NGINX One will be deployed on the F5 Distributed Cloud, adjoining NGINX One users with many additional capabilities. They can easily network across clouds with our Multicloud Network fabric without enduring complex integrations. They can configure granular security policies for specific teams and applications at the global firewall layer with less toil and fewer tickets. NGINX One users will benefit from our global network of points-of-presence, bringing applications much closer to end-users without having to bring in an additional content delivery network layer.

F5 users can easily leverage NGINX One to discover all instances of NGINX running in their enterprise environments and instrument those instances for better observability. In addition, F5’s security portfolio shares a single WAF engine, commonly referred to as “OneWAF”. This allows organizations to migrate the same policies they use in BIG-IP Advanced WAF to NGINX App Protect and to keep those policies synchronized.

A View into the Future

As we continue to mature NGINX One, we will ensure greater availability and scalability of your applications and infrastructure. We will do this by keeping your apps online with built-in high-availability and granular traffic controls, and by addressing predictable and unpredictable changes through automation and extensibility. And when you discover issues and automatically apply supervised configuration changes to multiple instances simultaneously you dramatically reduce your operational costs.

You will be able to resolve problems before your customers notice any disruptions by leveraging detailed AI-driven insights into the health of your apps, APIs, and infrastructure.
Identifying trends and cycles with historical data will enable you to accurately assess upcoming requirements, make better decisions, and streamline troubleshooting.

You can secure and control your network, applications and APIs while ensuring that your DevOps teams can integrate seamlessly with their CI/CD systems and tooling. Security will be closer to your application code and APIs and will be delivered on the shift-left promise. Organizations implementing zero trust will be able to validate users from edge to cloud without introducing complexity or unnecessary overhead. Moreover, you’ll further enhance your security posture by immediately discovering and quickly mitigating NGINX instances impacted by common vulnerabilities and exposures (CVEs), ensuring uniform protection across your infrastructure.

NGINX One will also change the way that you consume our product. We are moving to a SaaS-delivered model that allows you to pay for a single product and deliver our services wherever your teams need them –in your datacenter, the public cloud, or F5 Distributed Cloud. In the future more capabilities will come to our data plane, such as Webassembly. We will introduce new use cases like AI gateway. We are making it frictionless and ridiculously easy for you to consume these services with a consumption-based tiered pricing.

There will even be a free tier for a small number of NGINX instances and first-time customers. With consumption pricing you have a risk-free entry with low upfront costs.

It will be easier for procurement teams, because NGINX One will be included in all F5’s buying programs, including our Flexible Consumption Program.

No longer will pricing be a barrier for development teams. With NGINX One they will get all the capabilities and management that they need to secure, deliver, and optimize every App and API everywhere.

When Can I Get NGINX One, and How Can I Prepare?

In light of our recent news, many NGINX customers have asked when they can purchase NGINX One and what can they do now to get ready.

We expect NGINX One to be commercially available later this year. However, as mentioned above, customers can raise their hands now to get early access, try it out, and share their feedback for us to incorporate into our planning. In the meantime, all commercially available NGINX products will be compatible with NGINX One, so there is no need to worry that near-term purchases will soon be obsolete. They won’t.

In preparation to harness all the benefits of NGINX One, customers should ensure they are using the latest releases of their NGINX instances and ensure they are running NGINX Instance Manager as prescribed in their license.

The Ingress Controller: Touchstone for Securing AI/ML Apps in Kubernetes

One of the key advantages of running artificial intelligence (AI) and machine learning (ML) workloads in Kubernetes is a having a central point of control for all incoming requests through the Ingress Controller. It is a versatile module that serves as a load balancer and API gateway, providing a solid foundation for securing AI/ML applications in a Kubernetes environment.

As a unified tool, the Ingress Controller is a convenient touchpoint for applying security and performance measures, monitoring activity, and mandating compliance. More specifically, securing AI/ML applications at the Ingress Controller in a Kubernetes environment offers several strategic advantages that we explore in this blog.

Diagram of Ingress Controller ecosystem

Centralized Security and Compliance Control

Because Ingress Controller acts as a gateway to your Kubernetes cluster, it allows MLOps and platform engineering teams to implement a centralized point for enforcing security policies. This reduces the complexity of configuring security settings on a per-pod or per-service basis. By centralizing security controls at the Ingress level, you simplify the compliance process and make it easier to manage and monitor compliance status.

Consolidated Authentication and Authorization

The Ingress Controller is also the logical location to implement and enforce authentication and authorization for access to all your AI/ML applications. By adding strong certificate authority management, the Ingress Controller is also the linchpin of building zero trust (ZT) architectures for Kubernetes. ZT is crucial for ensuring continuous security and compliance of sensitive AI applications running on highly valuable proprietary data.

Rate Limiting and Access Control

The Ingress Controller is an ideal place to enforce rate limiting, protecting your applications from abuse, like DDoS attacks or excessive API calls, which is crucial for public-facing AI/ML APIs. With the rise of novel AI threats like model theft and data leaking, enforcing rate limiting and access control becomes more important in protecting against brute force attacks. It also helps prevent adversaries from abusing business logic or jailbreaking guardrails to extract data and model training or weight information.

Web Application Firewall (WAF) Integration

Many Ingress Controllers support integration with WAFs, which are table stakes for protecting exposed applications and services. WAFs provide an additional layer of security against common web vulnerabilities and attacks like the OWASP 10. Even more crucial, when properly tuned, WAFs protect against more targeted attacks aimed at AI/ML applications. A key consideration for AI/ML apps, where latency and performance are crucial, is potential overhead introduced by a WAF. Also, to be effective for AI/ML apps, the WAF must be tightly integrated into the Ingress Controller for monitoring and observability dashboards and alerting structures. If the WAF and Ingress Controller can share a common data plane, this is ideal.

Conclusion: Including the Ingress Controller Early in Planning for AI/ML Architectures

Because the Ingress Controller occupies such an important place in Kubernetes application deployment for AI/ML apps, it is best to include its capabilities as part of architecting AI/ML applications. This can alleviate duplication of functionality and can lead to a better decision on an Ingress Controller that will scale and grow with your AI/ML application needs. For MLOps teams, the Ingress Controller becomes a central control point for many of their critical platform and ops capabilities, with security among the top priorities.

Get Started with NGINX

NGINX offers a comprehensive set of tools and building blocks to meet your needs and enhance security, scalability, and observability of your Kubernetes platform.

You can get started today by requesting a free 30-day trial of Connectivity Stack for Kubernetes.

Scale, Secure, and Monitor AI/ML Workloads in Kubernetes with Ingress Controllers

AI and machine learning (AI/ML) workloads are revolutionizing how businesses operate and innovate. Kubernetes, the de facto standard for container orchestration and management, is the platform of choice for powering scalable large language model (LLM) workloads and inference models across hybrid, multi-cloud environments.

In Kubernetes, Ingress controllers play a vital role in delivering and securing containerized applications. Deployed at the edge of a Kubernetes cluster, they serve as the central point of handling communications between users and applications.

In this blog, we explore how Ingress controllers and F5 NGINX Connectivity Stack for Kubernetes can help simplify and streamline model serving, experimentation, monitoring, and security for AI/ML workloads.

Deploying AI/ML Models in Production at Scale

When deploying AI/ML models at scale, out-of-the-box Kubernetes features and capabilities can help you:

  • Accelerate and simplify the AI/ML application release life cycle.
  • Enable AI/ML workload portability across different environments.
  • Improve compute resource utilization efficiency and economics.
  • Deliver scalability and achieve production readiness.
  • Optimize the environment to meet business SLAs.

At the same time, organizations might face challenges with serving, experimenting, monitoring, and securing AI/ML models in production at scale:

  • Increasing complexity and tool sprawl makes it difficult for organizations to configure, operate, manage, automate, and troubleshoot Kubernetes environments on-premises, in the cloud, and at the edge.
  • Poor user experiences because of connection timeouts and errors due to dynamic events, such as pod failures and restarts, auto-scaling, and extremely high request rates.
  • Performance degradation, downtime, and slower and harder troubleshooting in complex Kubernetes environments due to aggregated reporting and lack of granular, real-time, and historical metrics.
  • Significant risk of exposure to cybersecurity threats in hybrid, multi-cloud Kubernetes environments because traditional security models are not designed to protect loosely coupled distributed applications.

Enterprise-class Ingress controllers like F5 NGINX Ingress Controller can help address these challenges. By leveraging one tool that combines Ingress controller, load balancer, and API gateway capabilities, you can achieve better uptime, protection, and visibility at scale – no matter where you run Kubernetes. In addition, it reduces complexity and operational cost.

Diagram of NGINX Ingress Controller ecosystem

NGINX Ingress Controller can also be tightly integrated with an industry-leading Layer 7 app protection technology from F5 that helps mitigate OWASP Top 10 cyberthreats for LLM Applications and defends AI/ML workloads from DoS attacks.

Benefits of Ingress Controllers for AI/ML Workloads

Ingress controllers can simplify and streamline deploying and running AI/ML workloads in production through the following capabilities:

  • Model serving – Deliver apps non-disruptively with Kubernetes-native load balancing, auto-scaling, rate limiting, and dynamic reconfiguration features.
  • Model experimentation – Implement blue-green and canary deployments, and A/B testing to roll out new versions and upgrades without downtime.
  • Model monitoring – Collect, represent, and analyze model metrics to gain better insight into app health and performance.
  • Model security – Configure user identity, authentication, authorization, role-based access control, and encryption capabilities to protect apps from cybersecurity threats.

NGINX Connectivity Stack for Kubernetes includes NGINX Ingress Controller and F5 NGINX App Protect to provide fast, reliable, and secure communications between Kubernetes clusters running AI/ML applications and their users – on-premises and in the cloud. It helps simplify and streamline model serving, experimentation, monitoring, and security across any Kubernetes environment, enhancing capabilities of cloud provider and pre-packaged Kubernetes offerings with higher degree of protection, availability, and observability at scale.

Get Started with NGINX Connectivity Stack for Kubernetes

NGINX offers a comprehensive set of tools and building blocks to meet your needs and enhance security, scalability, and visibility of your Kubernetes platform.

You can get started today by requesting a free 30-day trial of Connectivity Stack for Kubernetes.

Dynamic A/B Kubernetes Multi-Cluster Load Balancing and Security Controls with NGINX Plus

You’re a modern Platform Ops or DevOps engineer. You use a library of open source (and maybe some commercial) tools to test, deploy, and manage new apps and containers for your Dev team. You’ve chosen Kubernetes to run these containers and pods in development, test, staging, and production environments. You’ve bought into the architectures and concepts of microservices and, for the most part, it works pretty well. However, you’ve encountered a few speed bumps along this journey.

For instance, as you build and roll out new clusters, services, and applications, how do you easily integrate or migrate these new resources into production without dropping any traffic? Traditional networking appliances require reloads or reboots when implementing configuration changes to DNS records, load balancers, firewalls, and proxies. These adjustments are not reconfigurable without causing downtime because a “service outage” or “maintenance window” is required to update DNS, load balancer, and firewall rules. More often than not, you have to submit a dreaded service ticket and wait for another team to approve and make the changes.

Maintenance windows can drive your team into a ditch, stall application delivery, and make you declare, “There must be a better way to manage traffic!” So, let’s explore a solution that gets you back in the fast lane.

Active-Active Multi-Cluster Load Balancing

If you have multiple Kubernetes clusters, it’s ideal to route traffic to both clusters at the same time. An even better option is to perform A/B, canary, or blue-green traffic splitting and send a small percentage of your traffic as a test. To do this, you can use NGINX Plus with ngx_http_split_clients_module.

K8s with NGINX Plus diagram

The HTTP Split Clients module is written by NGINX Open Source and allows the ratio of requests to be distributed based on a key. In this use case, the clusters are the “upstreams” of NGINX. So, as the client requests arrive, the traffic is split between two clusters. The key that is used to determine the client request is any available NGINX client $variable. That said, to control this for every request, use the $request_id variable, which is a unique number assigned by NGINX to every incoming request.

To configure the split ratios, determine which percentages you’d like to go to each cluster. In this example, we use K8s Cluster1 as a “large cluster” for production and Cluster2 as a “small cluster” for pre-production testing. If you had a small cluster for staging, you could use a 90:10 ratio and test 10% of your traffic on the small cluster to ensure everything is working before you roll out new changes to the large cluster. If that sounds too risky, you can change the ratio to 95:5. Truthfully, you can pick any ratio you’d like from 0 to 100%.

For most real-time production traffic, you likely want a 50:50 ratio where your two clusters are of equal size. But you can easily provide other ratios, based on the cluster size or other details. You can easily set the ratio to 0:100 (or 100:0) and upgrade, patch, repair, or even replace an entire cluster with no downtime. Let NGINX split_clients route the requests to the live cluster while you address issues on the other.


# Nginx Multi Cluster Load Balancing
# HTTP Split Clients Configuration for Cluster1:Cluster2 ratios
# Provide 100, 99, 50, 1, 0% ratios  (add/change as needed)
# Based on
# https://www.nginx.com/blog/dynamic-a-b-testing-with-nginx-plus/
# Chris Akker – Jan 2024
#
 
split_clients $request_id $split100 {
   * cluster1-cafe;                     # All traffic to cluster1
   } 

split_clients $request_id $split99 {
   99% cluster1-cafe;                   # 99% cluster1, 1% cluster2
   * cluster2-cafe;
   } 
 
split_clients $request_id $split50 { 
   50% cluster1-cafe;                   # 50% cluster1, 50% cluster2
   * cluster2-cafe;
   }
    
split_clients $request_id $split1 { 
   1.0% cluster1-cafe;                  # 1% to cluster1, 99% to cluster2
   * cluster2-cafe;
   }

split_clients $request_id $split0 { 
   * cluster2-cafe;                     # All traffic to cluster2
   }
 
# Choose which cluster upstream based on the ratio
 
map $split_level $upstream { 
   100 $split100; 
   99 $split99; 
   50 $split50; 
   1.0 $split1; 
   0 $split0;
   default $split50;
}

You can add or edit the configuration above to match the ratios that you need (e.g., 90:10, 80:20, 60:40, and so on).

Note: NGINX also has a Split Clients module for TCP connections in the stream context, which can be used for non-HTTP traffic. This splits the traffic based on new TCP connections, instead of HTTP requests.

NGINX Plus Key-Value Store

The next feature you can use is the NGINX Plus key-value store. This is a key-value object in an NGINX shared memory zone that can be used for many different data storage use cases. Here, we use it to store the split ratio value mentioned in the section above. NGINX Plus allows you to change any key-value record without reloading NGINX. This enables you to change this split value with an API call, creating the dynamic split function.

Based on our example, it looks like this:

{“cafe.example.com”:90}

This KeyVal record reads:
The Key is the “cafe.example.com” hostname
The Value is “90” for the split ratio

Instead of hard-coding the split ratio in the NGINX configuration files, you can instead use the key-value memory. This eliminates the NGINX reload required to change a static split value in NGINX.

In this example, NGINX is configured to use 90:10 for the split ratio with the large Cluster1 for the 90% and the small Cluster2 for the remaining 10%. Because this is a key-value record, you can change this ratio using the NGINX Plus API dynamically with no configuration reloads! The Split Clients module will use this new ratio value as soon as you change it, on the very next request.

Create the KV Record, start with a 50/50 ratio:

Add a new record to the KeyValue store, by sending an API command to NGINX Plus:

curl -iX POST -d '{"cafe.example.com":50}' http://nginxlb:9000/api/8/http/keyvals/split

Change the KV Record, change to the 90/10 ratio:

Change the KeyVal Split Ratio to 90, using an HTTP PATCH Method to update the KeyVal record in memory:

curl -iX PATCH -d '{"cafe.example.com":90}' http://nginxlb:9000/api/8/http/keyvals/split

Next, the pre-production testing team verifies the new application code is ready, you deploy it to the large Cluster1, and change the ratio to 100%. This immediately sends all the traffic to Cluster1 and your new application is “live” without any disruption to traffic, no service outages, no maintenance windows, reboots, reloads, or lots of tickets. It only takes one API call to change this split ratio at the time of your choosing.

Of course, being that easy to move from 90% to 100% means you have an easy way to change the ratio from 100:0 to 50:50 (or even 0:100). So, you can have a hot backup cluster or can scale your clusters horizontally with new resources. At full throttle, you can even completely build a new cluster with the latest software, hardware, and software patches – deploying the application and migrating the traffic over a period of time without dropping a single connection!

Use Cases

Using the HTTP Split Clients module with the dynamic key-value store can deliver the following use cases:

  • Active-active load balancing – For load balancing to multiple clusters.
  • Active-passive load balancing – For load balancing to primary, backup, and DR clusters and applications.
  • A/B, blue-green, and canary testing – Used with new Kubernetes applications.
  • Horizontal cluster scaling – Adds more cluster resources and changes the ratio when you’re ready.
  • Hitless cluster upgrades – Ability to use one cluster while you upgrade, patch, or repair the other cluster.
  • Instant failover – If one cluster has a serious issue, you can change the ratio to use your other cluster.

Configuration Examples

Here is an example of the key-value configuration:

# Define Key Value store, backup state file, timeout, and enable sync
 
keyval_zone zone=split:1m state=/var/lib/nginx/state/split.keyval timeout=365d sync;

keyval $host $split_level zone=split;

And this is an example of the cafe.example.com application configuration:

# Define server and location blocks for cafe.example.com, with TLS

server {
   listen 443 ssl;
   server_name cafe.example.com; 

   status_zone https://cafe.example.com;
      
   ssl_certificate /etc/ssl/nginx/cafe.example.com.crt; 
   ssl_certificate_key /etc/ssl/nginx/cafe.example.com.key;
   
   location / {
   status_zone /;
   
   proxy_set_header Host $host;
   proxy_http_version 1.1;
   proxy_set_header "Connection" "";
   proxy_pass https://$upstream;   # traffic split to upstream blocks
   
   }

# Define 2 upstream blocks – one for each cluster
# Servers managed dynamically by NLK, state file backup

# Cluster1 upstreams
 
upstream cluster1-cafe {
   zone cluster1-cafe 256k;
   least_time last_byte;
   keepalive 16;
   #servers managed by NLK Controller
   state /var/lib/nginx/state/cluster1-cafe.state; 
}
 
# Cluster2 upstreams
 
upstream cluster2-cafe {
   zone cluster2-cafe 256k;
   least_time last_byte;
   keepalive 16;
   #servers managed by NLK Controller
   state /var/lib/nginx/state/cluster2-cafe.state; 
}

The upstream server IP:ports are managed by NGINX Loadbalancer for Kubernetes, a new controller that also uses the NGINX Plus API to configure NGINX Plus dynamically. Details are in the next section.

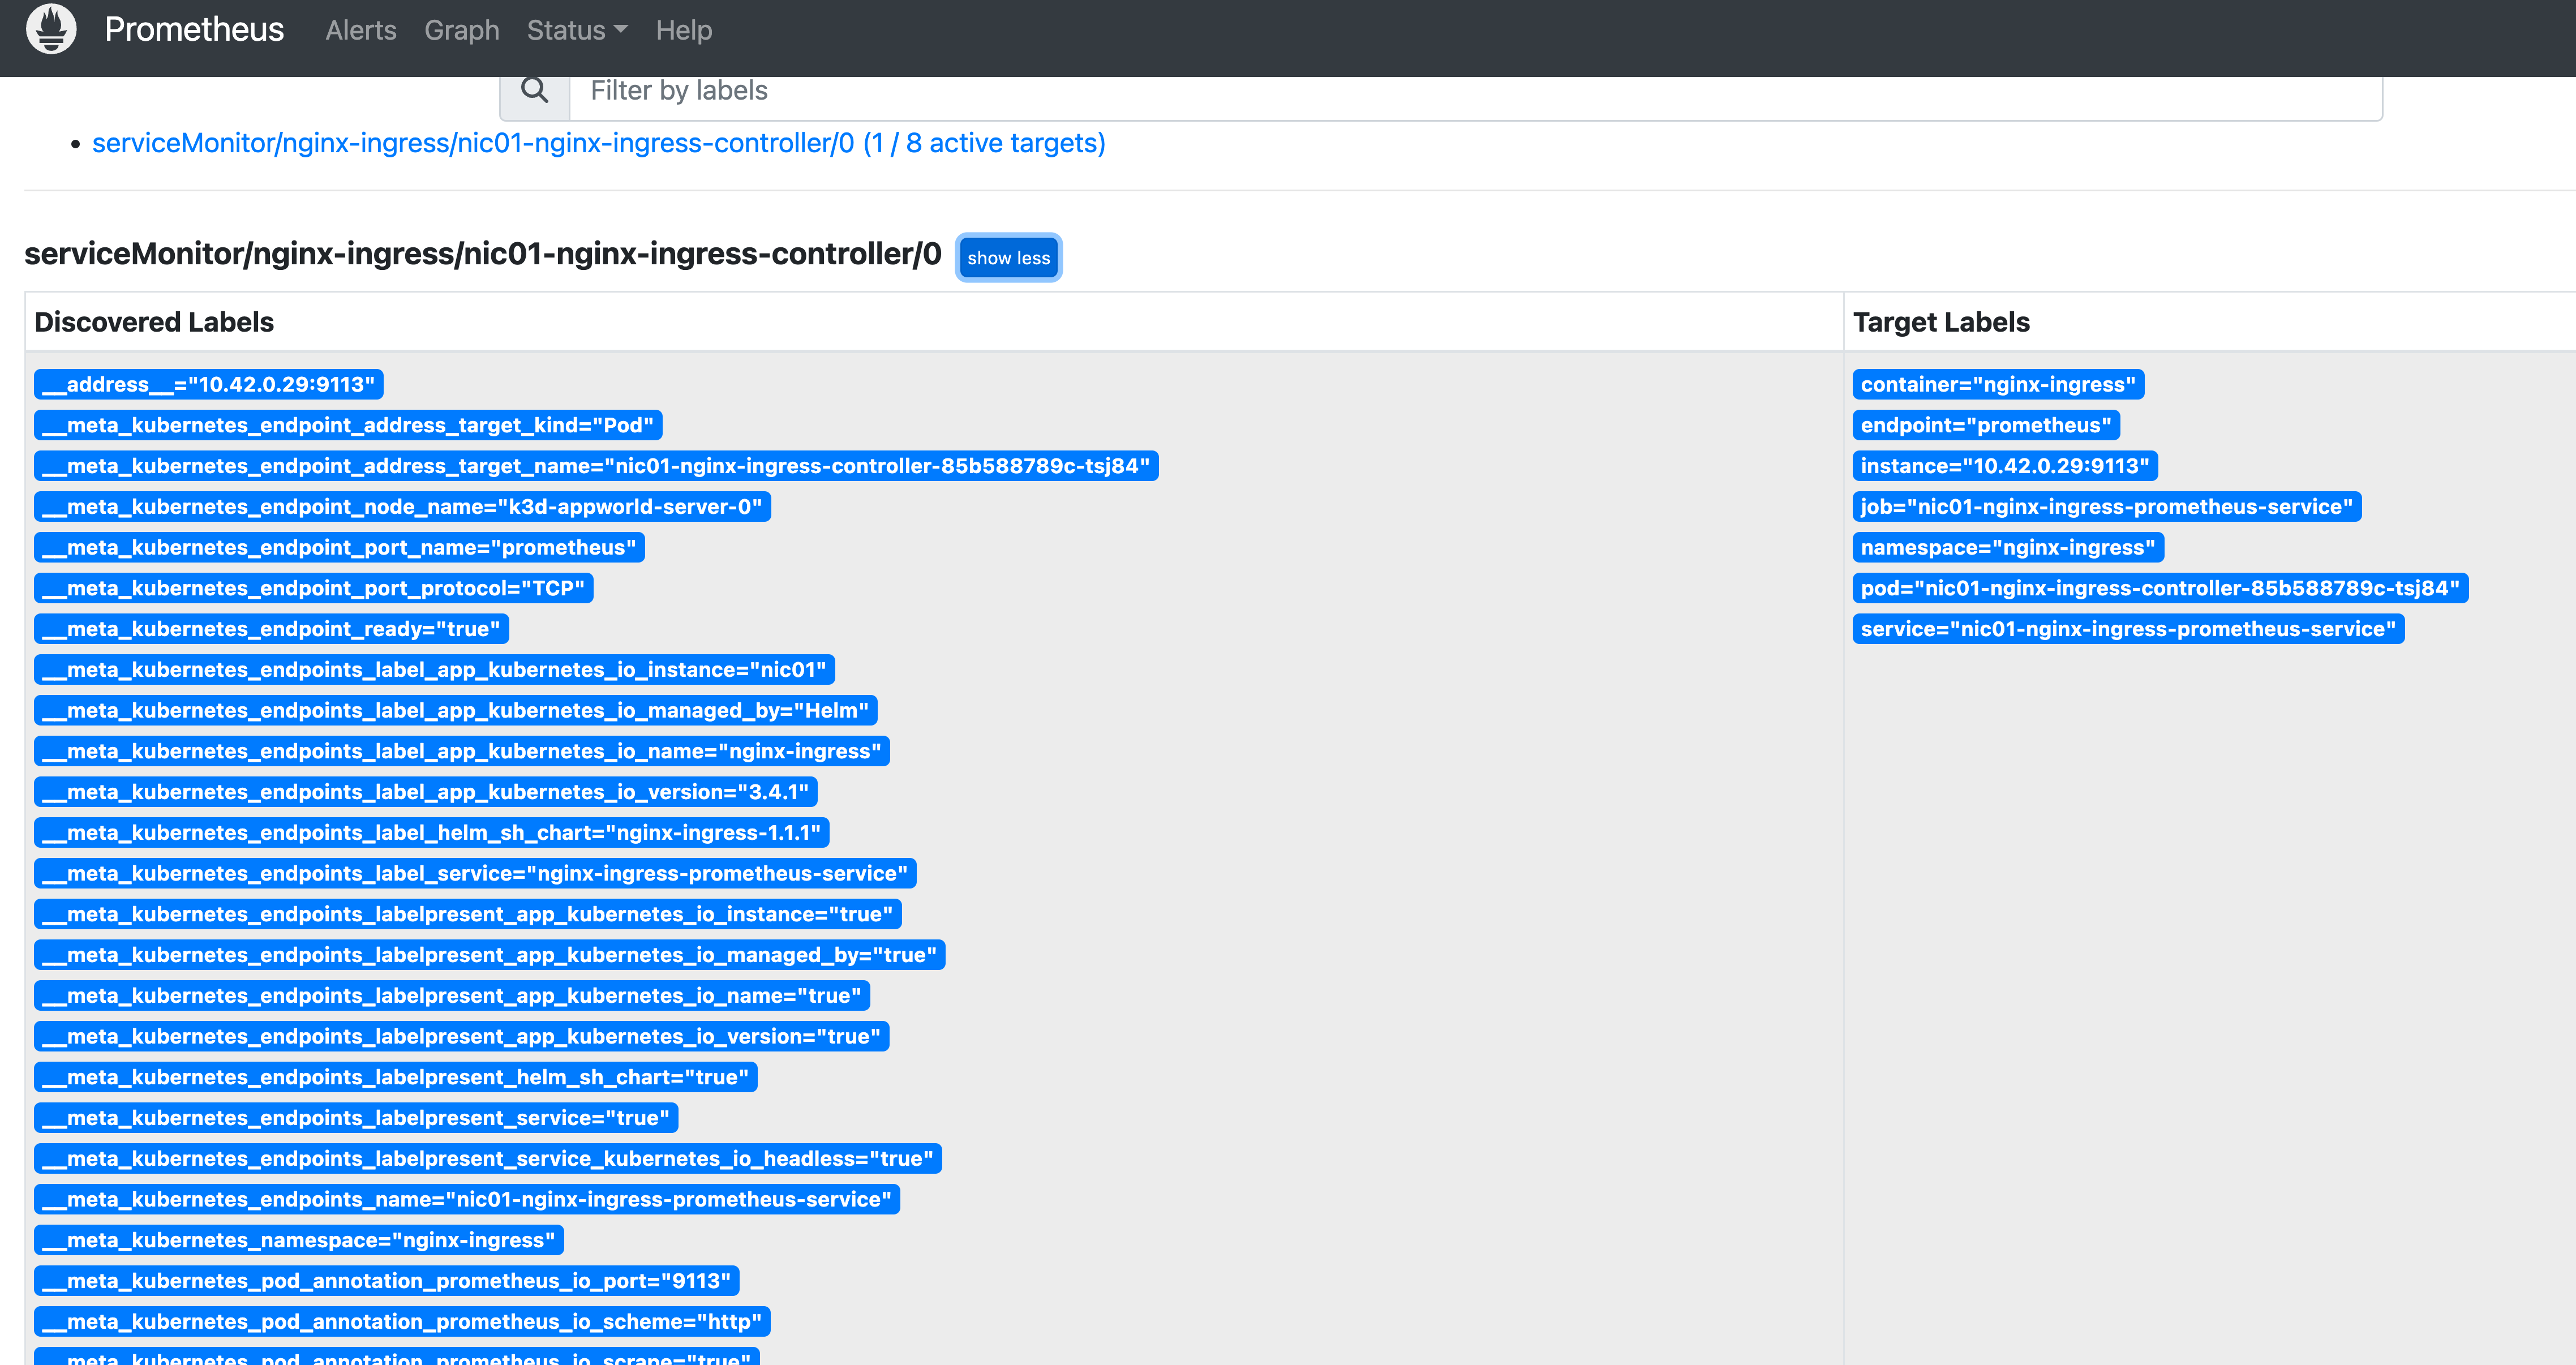
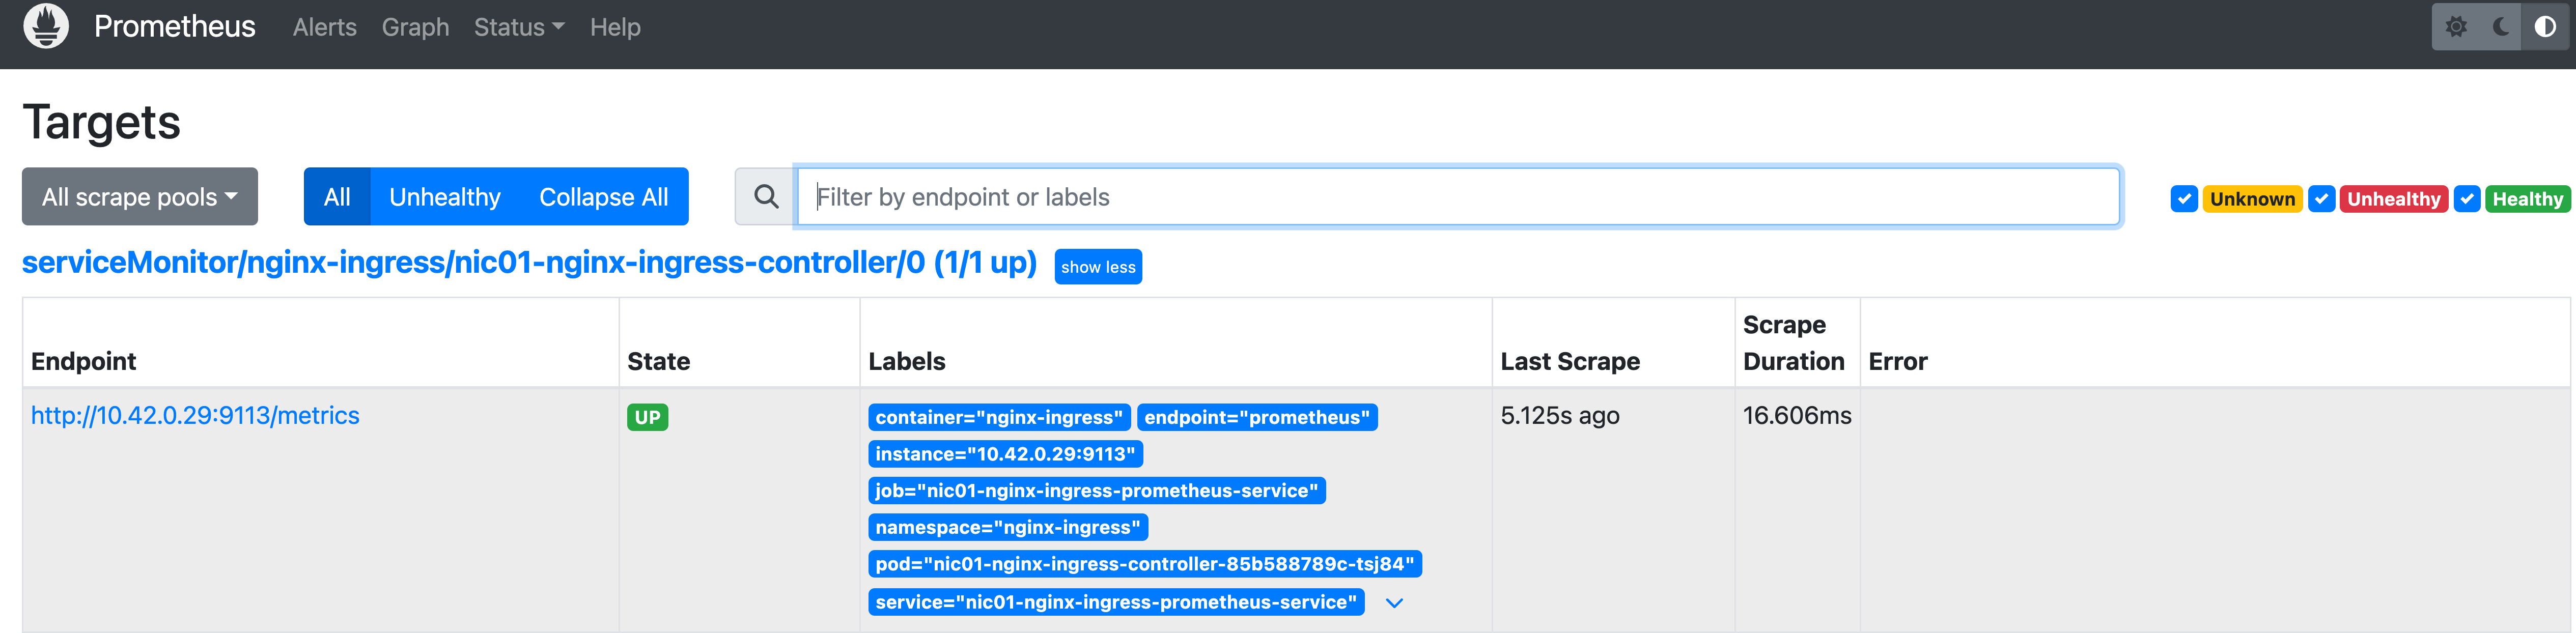
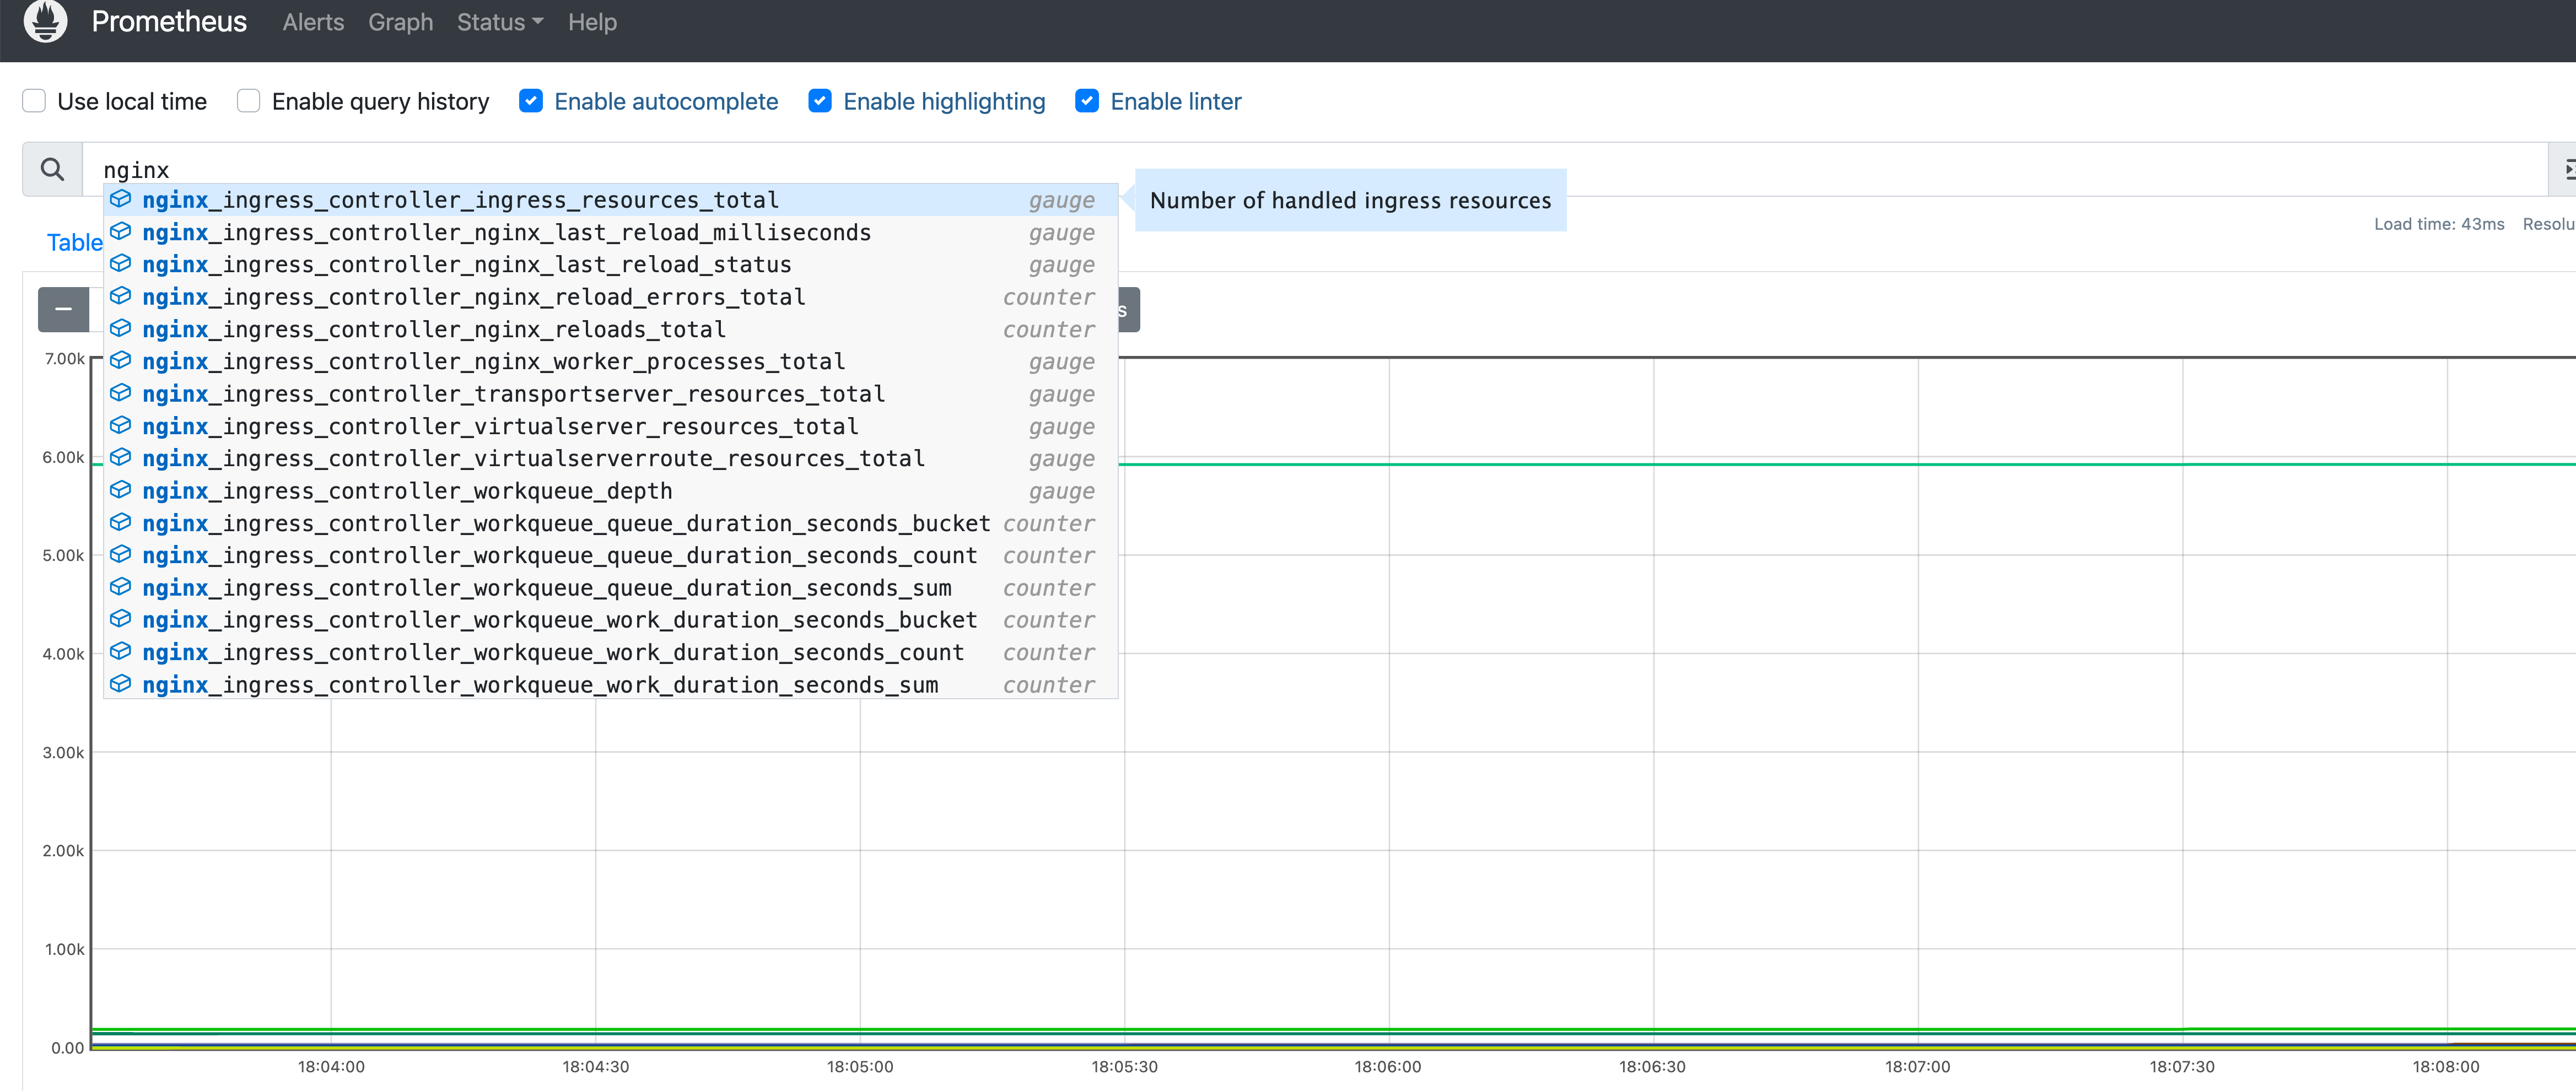
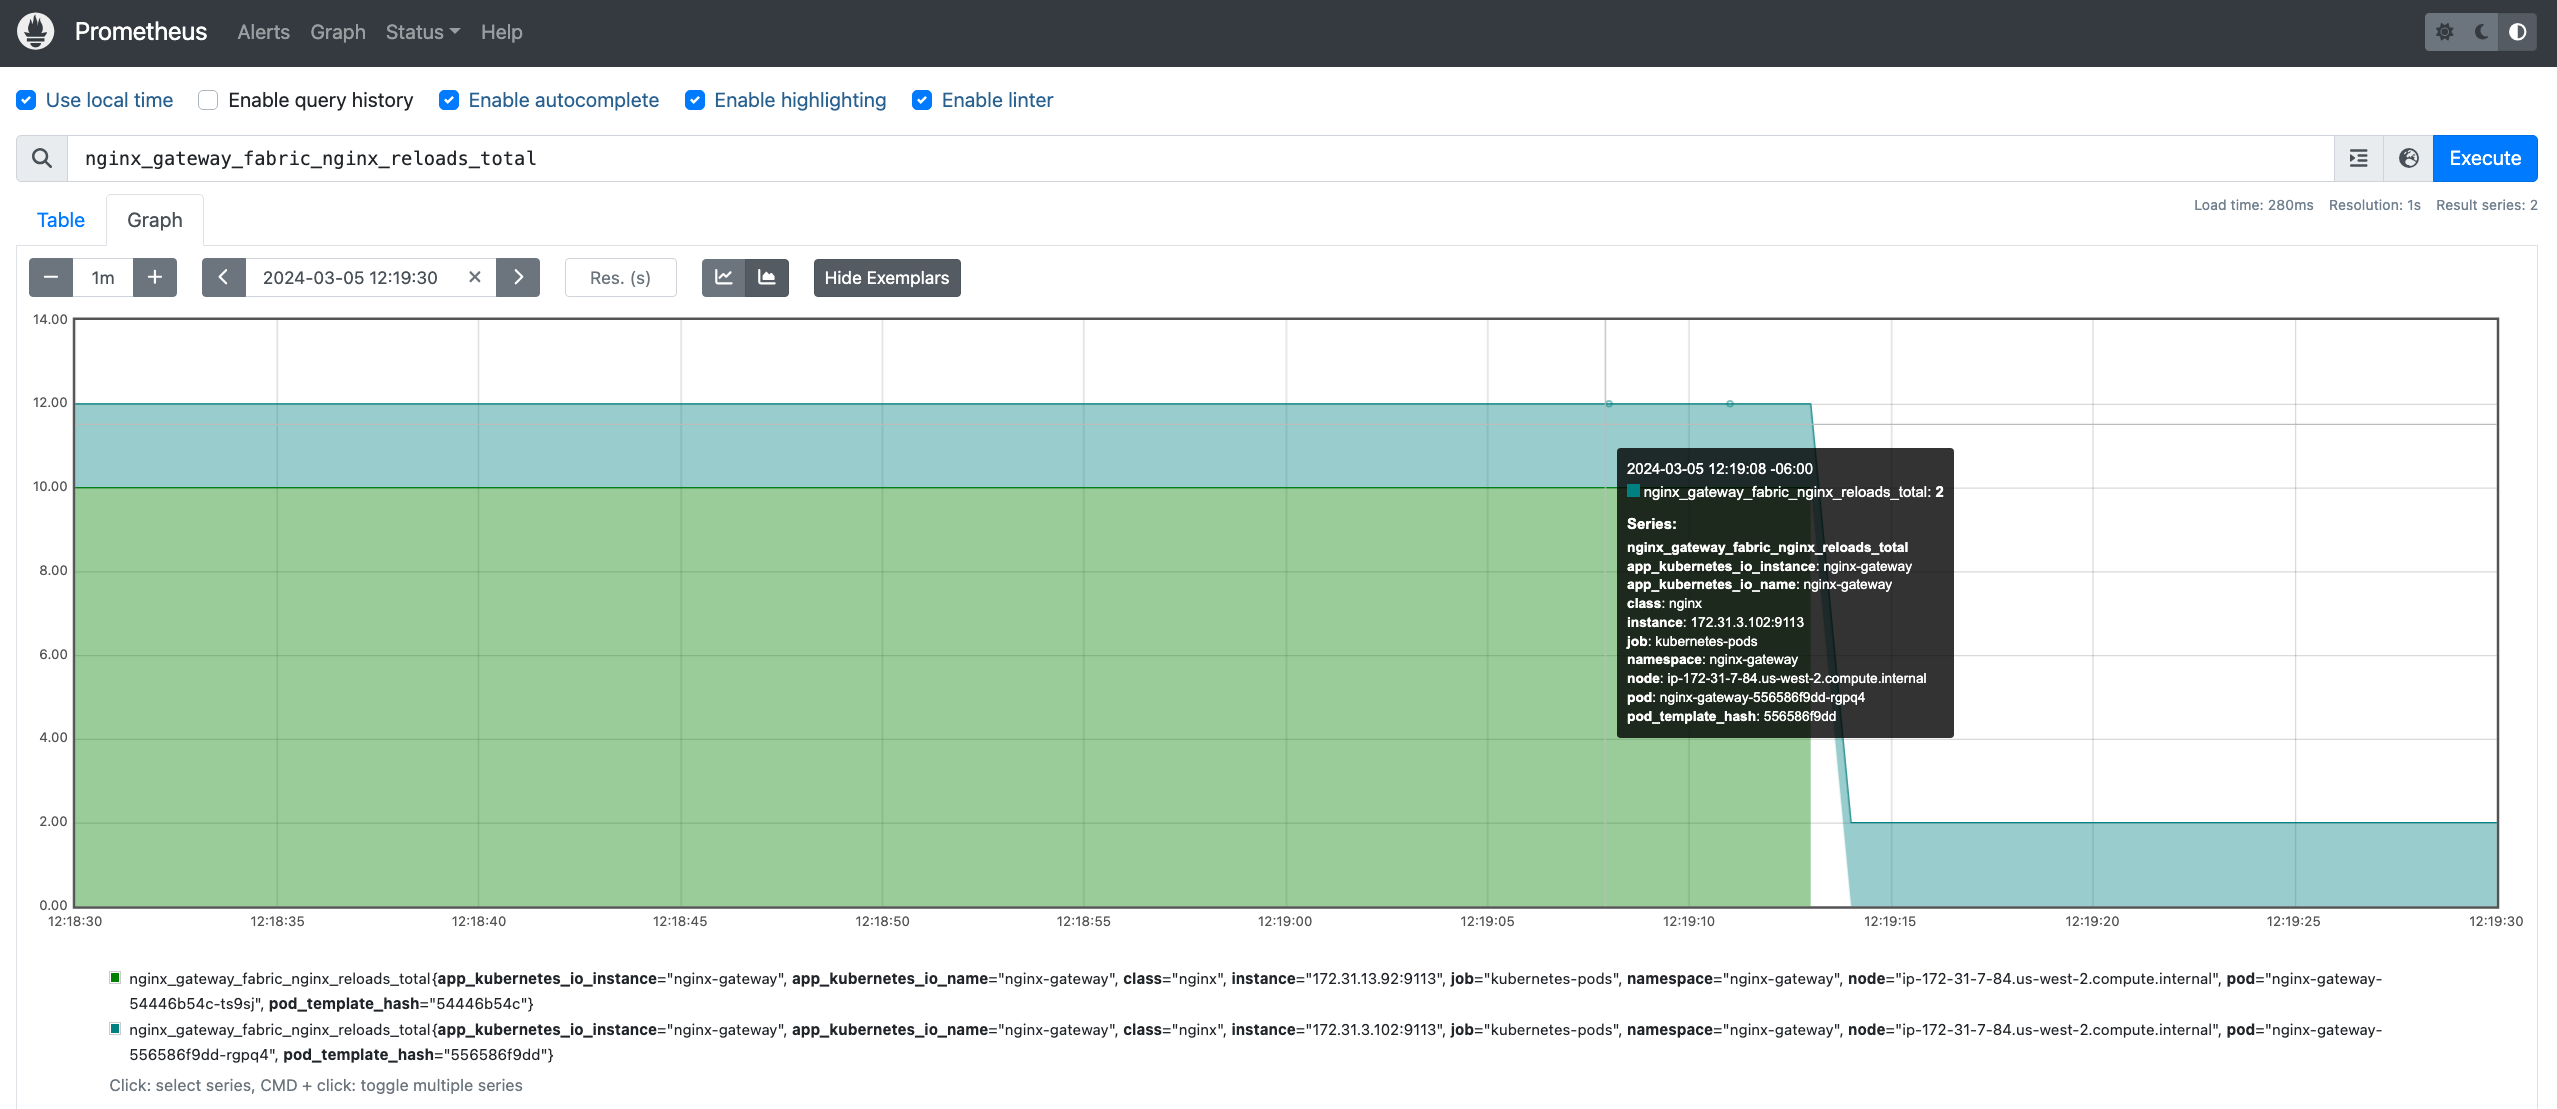
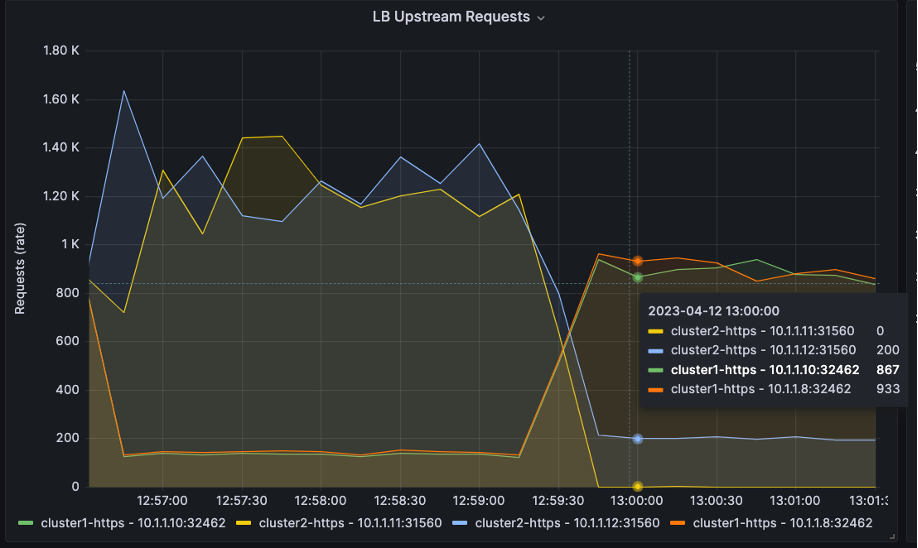
Let’s take a look at the HTTP split traffic over time with Grafana, a popular monitoring and visualization tool. You use the NGINX Prometheus Exporter (based on njs) to export all of your NGINX Plus metrics, which are then collected and graphed by Grafana. Details for configuring Prometheus and Grafana can be found here.

There are four upstreams servers in the graph: Two for Cluster1 and two for Cluster2. We use an HTTP load generation tool to create HTTP requests and send them to NGINX Plus.

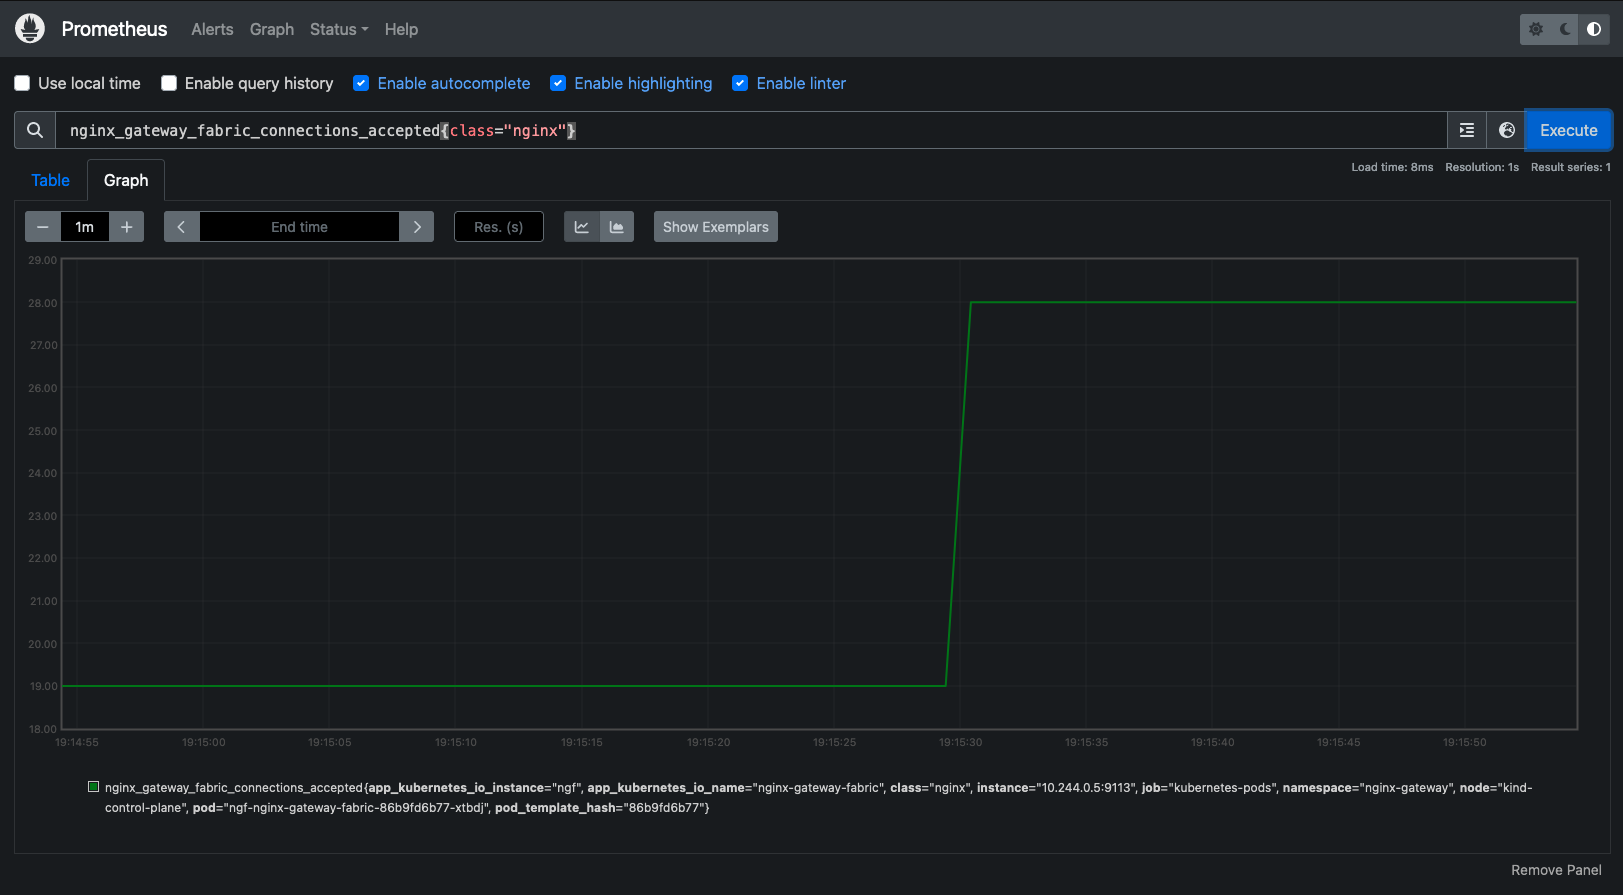
In the three graphs below, you can see the split ratio is at 50:50 at the beginning of the graph.

LB Upstream Requests diagram

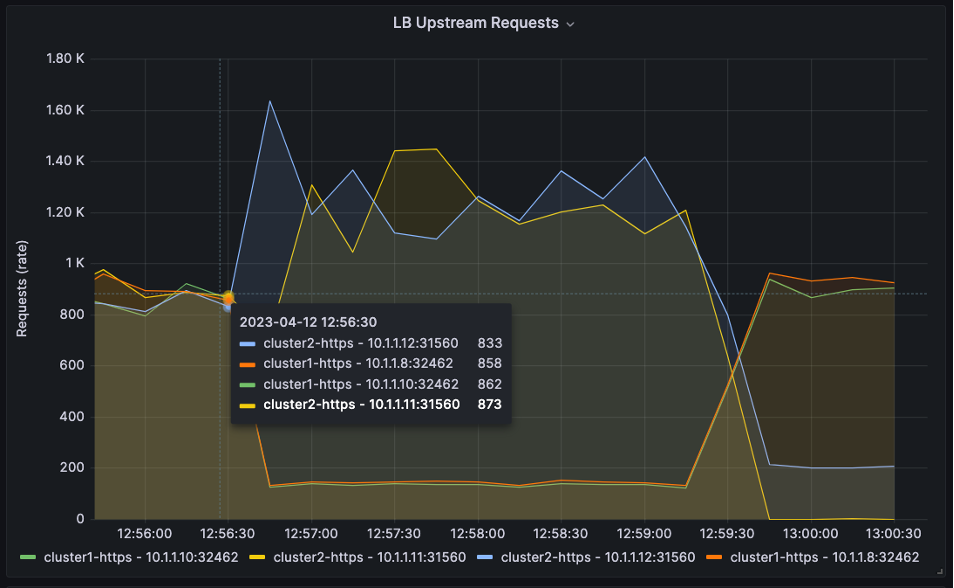
Then, the ratio changes to 10:90 at 12:56:30.

LB Upstream Requests diagram

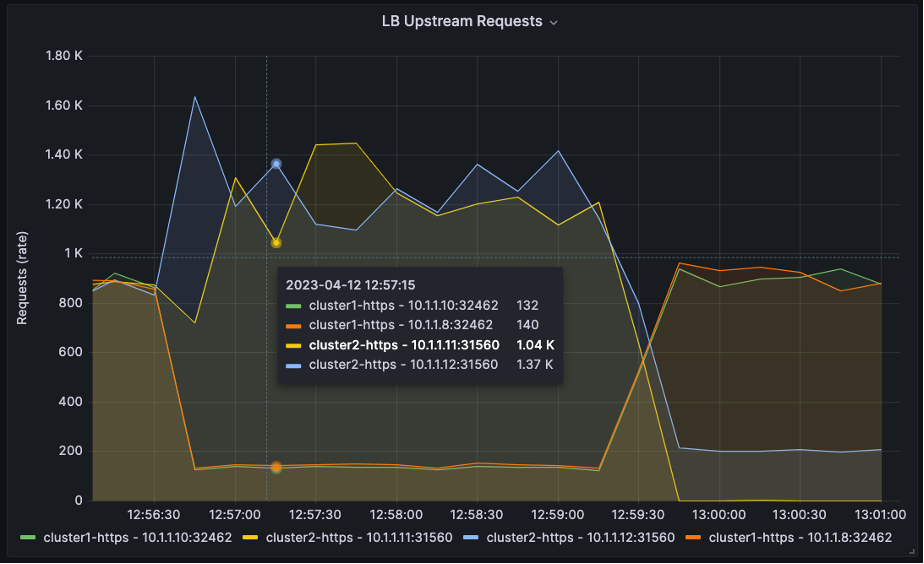
Then it changes to 90:10 at 13:00:00.

LB Upstream Requests diagram

You can find working configurations of Prometheus and Grafana on the NGINX Loadbalancer for Kubernetes GitHub repository.

Dynamic HTTP Upstreams: NGINX Loadbalancer for Kubernetes

You can change the static NGINX Upstream configuration to dynamic cluster upstreams using the NGINX Plus API and the NGINX Loadbalancer for Kubernetes controller. This free project is a Kubernetes controller that watches NGINX Ingress Controller and automatically updates an external NGINX Plus instance configured for TCP/HTTP load balancing. It’s very straightforward in design and simple to install and operate. With this solution in place, you can implement TCP/HTTP load balancing in Kubernetes environments, ensuring new apps and services are immediately detected and available for traffic – with no reload required.

Architecture and Flow

NGINX Loadbalancer for Kubernetes sits inside a Kubernetes cluster. It is registered with Kubernetes to watch the NGINX Ingress Controller (nginx-ingress) Service. When there is a change to the Ingress controller(s), NGINX Loadbalancer for Kubernetes collects the Worker Ips and the NodePort TCP port numbers, then sends the IP:ports to NGINX Plus via the NGINX Plus API.

The NGINX upstream servers are updated with no reload required, and NGINX Plus load balances traffic to the correct upstream servers and Kubernetes NodePorts. Additional NGINX Plus instances can be added to achieve high availability.

Diagram of NGINX Loadbalancer in action

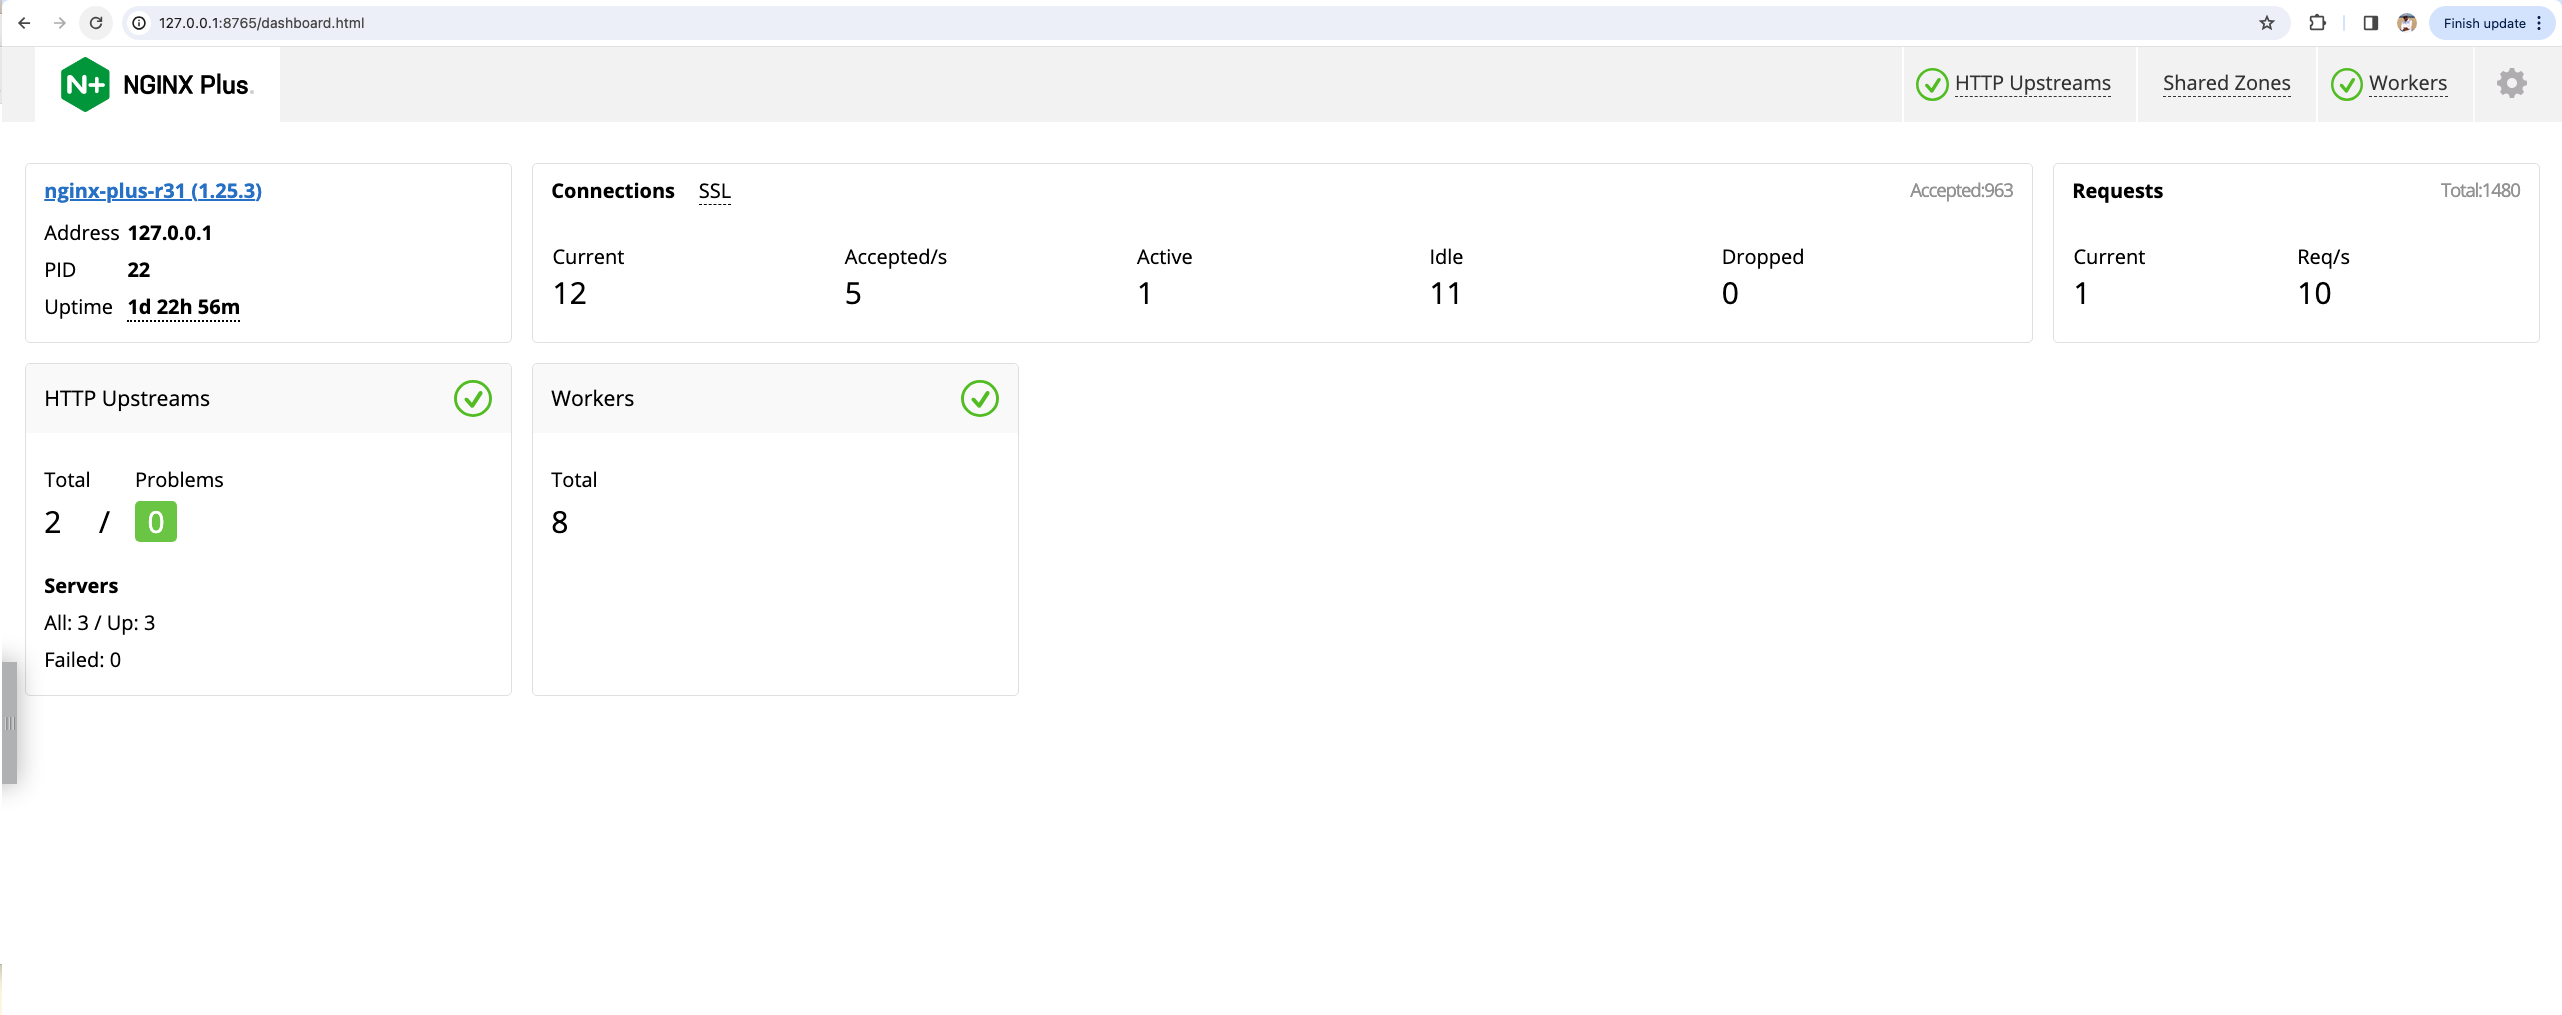
A Snapshot of NGINX Loadbalancer for Kubernetes in Action

In the screenshot below, there are two windows that demonstrate NGINX Loadbalancer for Kubernetes deployed and doing its job:

  1. Service TypeLoadBalancer for nginx-ingress
  2. External IP – Connects to the NGINX Plus servers
  3. Ports – NodePort maps to 443:30158 with matching NGINX upstream servers (as shown in the NGINX Plus real-time dashboard)
  4. Logs – Indicates NGINX Loadbalancer for Kubernetes is successfully sending data to NGINX Plus

NGINX Plus window

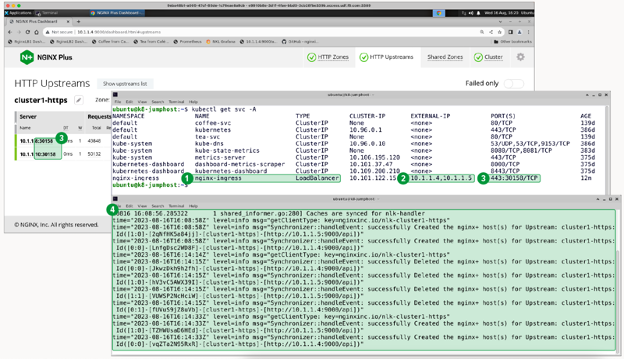
Note: In this example, the Kubernetes worker nodes are 10.1.1.8 and 10.1.1.10

Adding NGINX Plus Security Features

As more and more applications running in Kubernetes are exposed to the open internet, security becomes necessary. Fortunately, NGINX Plus has enterprise-class security features that can be used to create a layered, defense-in-depth architecture.

With NGINX Plus in front of your clusters and performing the split_clients function, why not leverage that presence and add some beneficial security features? Here are a few of the NGINX Plus features that could be used to enhance security, with links and references to other documentation that can be used to configure, test, and deploy them.

Get Started Today

If you’re frustrated with networking challenges at the edge of your Kubernetes cluster, consider trying out this NGINX multi-cluster Solution. Take the NGINX Loadbalancer for Kubernetes software for a test drive and let us know what you think. The source code is open source (under the Apache 2.0 license) and all installation instructions are available on GitHub.

To provide feedback, drop us a comment in the repo or message us in the NGINX Community Slack.

Updating NGINX for the Vulnerabilities in the HTTP/3 Module

Today, we are releasing updates to NGINX Plus, NGINX Open source, and NGINX Open Source subscription in response to the internally discovered vulnerabilities in the HTTP/3 module ngx_http_v3_module. These vulnerabilities were discovered based on two bug reports in NGINX open source (trac #2585 and trac #2586). Note that this module is not enabled by default and is documented as experimental.

The vulnerabilities have been registered in the Common Vulnerabilities and Exposures (CVE) database and the F5 Security Incident Response Team (F5 SIRT) has assigned scores to them using the Common Vulnerability Scoring System (CVSS v3.1) scale.

The following vulnerabilities in the HTTP/3 module apply to NGINX Plus, NGINX Open source subscription, and NGINX Open source.

CVE-2024-24989: The patch for this vulnerability is included in following software versions:

  • NGINX Plus R31 P1
  • NGINX Open source subscription R6 P1
  • NGINX Open source mainline version 1.25.4. (The latest NGINX Open source stable version 1.24.0 is not affected.)

CVE-2024-24990: The patch for this vulnerability is included in following software versions:

  • NGINX Plus R30 P2
  • NGINX Plus R31 P1
  • NGINX Open source subscription R5 P2
  • NGINX Open source subscription R6 P1
  • NGINX Open source mainline version 1.25.4. (The latest NGINX Open source stable version 1.24.0 is not affected.)

You are impacted if you are running NGINX Plus R30 or R31, NGINX Open source subscription packages R5 or R6 or NGINX Open source mainline version 1.25.3 or earlier. We strongly recommend that you upgrade your NGINX software to the latest version.

For NGINX Plus upgrade instructions, see Upgrading NGINX Plus in the NGINX Plus Admin Guide. NGINX Plus customers can also contact our support team for assistance at https://my.f5.com/.

NGINX’s Continued Commitment to Securing Users in Action

F5 NGINX is committed to a secure software lifecycle, including design, development, and testing optimized to find security concerns before release. While we prioritize threat modeling, secure coding, training, and testing, vulnerabilities do occasionally occur.

Last month, a member of the NGINX Open Source community reported two bugs in the HTTP/3 module that caused a crash in NGINX Open Source. We determined that a bad actor could cause a denial-of-service attack on NGINX instances by sending specially crafted HTTP/3 requests. For this reason, NGINX just announced two vulnerabilities: CVE-2024-24989 and CVE-2024-24990.

The vulnerabilities have been registered in the Common Vulnerabilities and Exposures (CVE) database, and the F5 Security Incident Response Team (F5 SIRT) has assigned them scores using the Common Vulnerability Scoring System (CVSS v3.1) scale.

Upon release, the QUIC and HTTP/3 features in NGINX were considered experimental. Historically, we did not issue CVEs for experimental features and instead would patch the relevant code and release it as part of a standard release. For commercial customers of NGINX Plus, the previous two versions would be patched and released to customers. We felt that not issuing a similar patch for NGINX Open Source would be a disservice to our community. Additionally, fixing the issue in the open source branch would have exposed users to the vulnerability without providing a binary.

Our decision to release a patch for both NGINX Open Source and NGINX Plus is rooted in doing what is right – to deliver highly secure software for our customers and community. Furthermore, we’re making a commitment to document and release a clear policy for how future security vulnerabilities will be addressed in a timely and transparent manner.

Meetup Recap: NGINX’s Commitments to the Open Source Community

Last week, we hosted the NGINX community’s first San Jose, California meetup since the outbreak of COVID-19. It was great to see our Bay Area open source community in person and hear from our presenters.

After an introduction by F5 NGINX General Manager Shawn Wormke, NGINX CTO and Co-Founder Maxim Konovalov detailed NGINX’s history – from the project’s “dark ages” through recent events. Building on that history, we looked to the future. Specifically, Principal Engineer Oscar Spencer and Principal Technical Product Manager Timo Stark covered the exciting new technology WebAssembly and how it can be used to solve complex problems securely and efficiently. Timo also gave us an overview of NGINX JavaScript (njs), breaking down its architecture and demonstrating ways it can solve many of today’s intricate application scenarios.

Above all, the highlight of the meetup was our renewed, shared set of commitments to NGINX’s open source community.

Our goal at NGINX is to continue to be an open source standard, similar to OpenSSL and Linux. Our open source projects are sponsored by F5 and, up until now, have been largely supported by paid employees of F5 with limited contributions from the community. While this has served our projects well, we believe that long-term success hinges on engaging a much larger and diverse community of contributors. Growing our open source community ensures that the best ideas are driving innovation, as we strive to solve complex problems with modern applications.

To achieve this goal, we are making the following commitments that will guarantee the longevity, transparency, and impact of our open source projects:

  • We will be open, consistent, transparent, and fair in our acceptance of contributions.
  • We will continue to enhance and open source new projects that move technology forward.
  • We will continue to offer projects under OSI-approved software licenses.
  • We will not remove and commercialize existing projects or features.
  • We will not impose limits on the use of our projects.

With these commitments, we hope that our projects will gain more community contributions, eventually leading to maintainers and core members outside of F5.

However, these commitments do present a pivotal change to our ways of working. For many of our projects that have a small number of contributors, this change will be straightforward. For our flagship NGINX proxy, with its long history and track record of excellence, these changes will take some careful planning. We want to be sensitive to this by ensuring plenty of notice to our community, so they may adopt and adjust to these changes with little to no disruption.

We are very excited about these commitments and their positive impact on our community. We’re also looking forward to opportunities for more meetups in the future! In the meantime, stay tuned for additional information and detailed timelines on this transition at nginx.org.