Editor – This post is part of a 10-part series:
- Reduce Complexity with Production-Grade Kubernetes
- How to Improve Resilience in Kubernetes with Advanced Traffic Management
- How to Improve Visibility in Kubernetes (this post)
- Six Ways to Secure Kubernetes Using Traffic Management Tools
- A Guide to Choosing an Ingress Controller, Part 1: Identify Your Requirements
- A Guide to Choosing an Ingress Controller, Part 2: Risks and Future-Proofing
- A Guide to Choosing an Ingress Controller, Part 3: Open Source vs. Default vs. Commercial
- A Guide to Choosing an Ingress Controller, Part 4: NGINX Ingress Controller Options
- How to Choose a Service Mesh
- Performance Testing NGINX Ingress Controllers in a Dynamic Kubernetes Cloud Environment
You can also download the complete set of blogs as a free eBook – Taking Kubernetes from Test to Production.
Adoption of microservices accelerates digital experiences, but microservices architectures can also make those experiences more fragile. While your developers are running fast to get new apps out the door, your architecture may be putting you at increased risk for outages, security exposures, and time wasted on inefficient troubleshooting or fixing preventable problems. In this second blog of our series on production‑grade Kubernetes, we examine how components that provide traffic visibility can reduce complexity and improve security in your microservices environments.
Gain Visibility to Attain Insight
First, let’s look at a couple of definitions:
- Visibility – The state of being able to see or be seen
- Insight – A deep understanding of a person or thing
In a 2020 survey from StackRox, 75% of Kubernetes users identified visibility as a “must‑have” capability. We agree that visibility is key in Kubernetes since it can be especially difficult to know what is deployed. And yet 95% of respondents to F5’s 2021 State of Application Strategy (SOAS) reported that although they have a wealth of data, they’re missing the insights into app performance, security, and availability that they need to protect and evolve their infrastructure and business. So why is insight important and how do you get it?
With insight, you can:
- Strengthen security and compliance by detecting vulnerabilities and possible attack vectors
- Reduce outages and downtime by discovering problems before your customers do
- Improve the efficiency of troubleshooting by finding the root cause of app issues
- Confirm that your traffic is going only where you want it to go
- Know exactly what’s running in your Kubernetes environments and whether it’s properly configured and secured
- Figure out whether you’re using the right amount of resources based on latency and performance history
- Predict seasonal needs based on past traffic patterns
- Measure performance in terms of response time to track performance against service level agreements (SLAs) and serve as an early warning system before problems affect the user experience
To gain insight, you need two types of visibility data: real‑time and historical. Real‑time data enables you to diagnose the source of a problem that’s happening right now, while historical data supplies perspective on what is “normal” versus what is an outlier. Combined, these two types of visibility sources can provide crucial insights into app and Kubernetes performance.
As with other technology investments, you also need a strategy for how to reap the benefits. The SOAS report also indicates that people fail to attain valuable insights due to organizational factors related to hiring and employee development, strategy and processes, and consensus on what the data should be used for, when, and by whom. Those findings include:
- Related skillsets – It’s no secret that there’s a shortage of skilled technology professionals, as confirmed by 47% of respondents reporting that they struggle to find the talent they need.
- Data‑sharing initiatives – Only 12% of respondents have processes and strategies in place for reporting data back to business decision makers to make them aware of the business impacts of resilient technology (or lack thereof).
- The purpose of visibility – Most respondents use telemetry reactively (that is, for troubleshooting) while only 24% of respondents proactively use data and insights to watch for potential performance degradations and 16% to track SLA performance.
The remainder of this post focuses on the technical aspects of insight. Keep an eye out for future blogs on strategy, process, and other topics.
How NGINX Can Help
We know that most Kubernetes deployments are already using a monitoring tool and don’t need yet another one. So we’ve instrumented the NGINX Plus API for easy export of metrics and provide integrations with popular tools like OpenTracing and Grafana and Prometheus, so you can get a full picture of performance inside your clusters. You get targeted insights into app performance and availability with deep traces so you can understand how requests are processed across your microservices apps.
-
Insight into ingress‑egress (north‑south) traffic
NGINX Ingress Controller provides insight into the traffic entering and exiting your Kubernetes clusters.Did you know there are three popular Ingress controllers based on NGINX? Not all of them are production‑ready, and the wrong choice might end up complicating rather than improving your microservices strategy. Our blog post Wait, Which NGINX Ingress Controller for Kubernetes Am I Using? provides a comparison of the options so you can make the best decision for your needs.
- Insight into east‑west traffic
NGINX Service Mesh provides insight into the traffic flowing among containerized apps.
Read on to find out how we can help with two common problems:
If you’re ready to see the technology in action, check out this live stream demo and AMA with NGINX and Grafana experts. You’ll see them demonstrate how to get live monitoring of key load‑balancing and performance metrics, export the metrics to Prometheus, and create Grafana dashboards for a view of cumulative performance.
Problem: My App Is Slow (or Down!)
Do you suspect a DDoS attack? Are users reporting errors from your website? You can’t begin to solve the problem until you figure out exactly where it lies.
-
Live monitoring with NGINX Ingress Controller
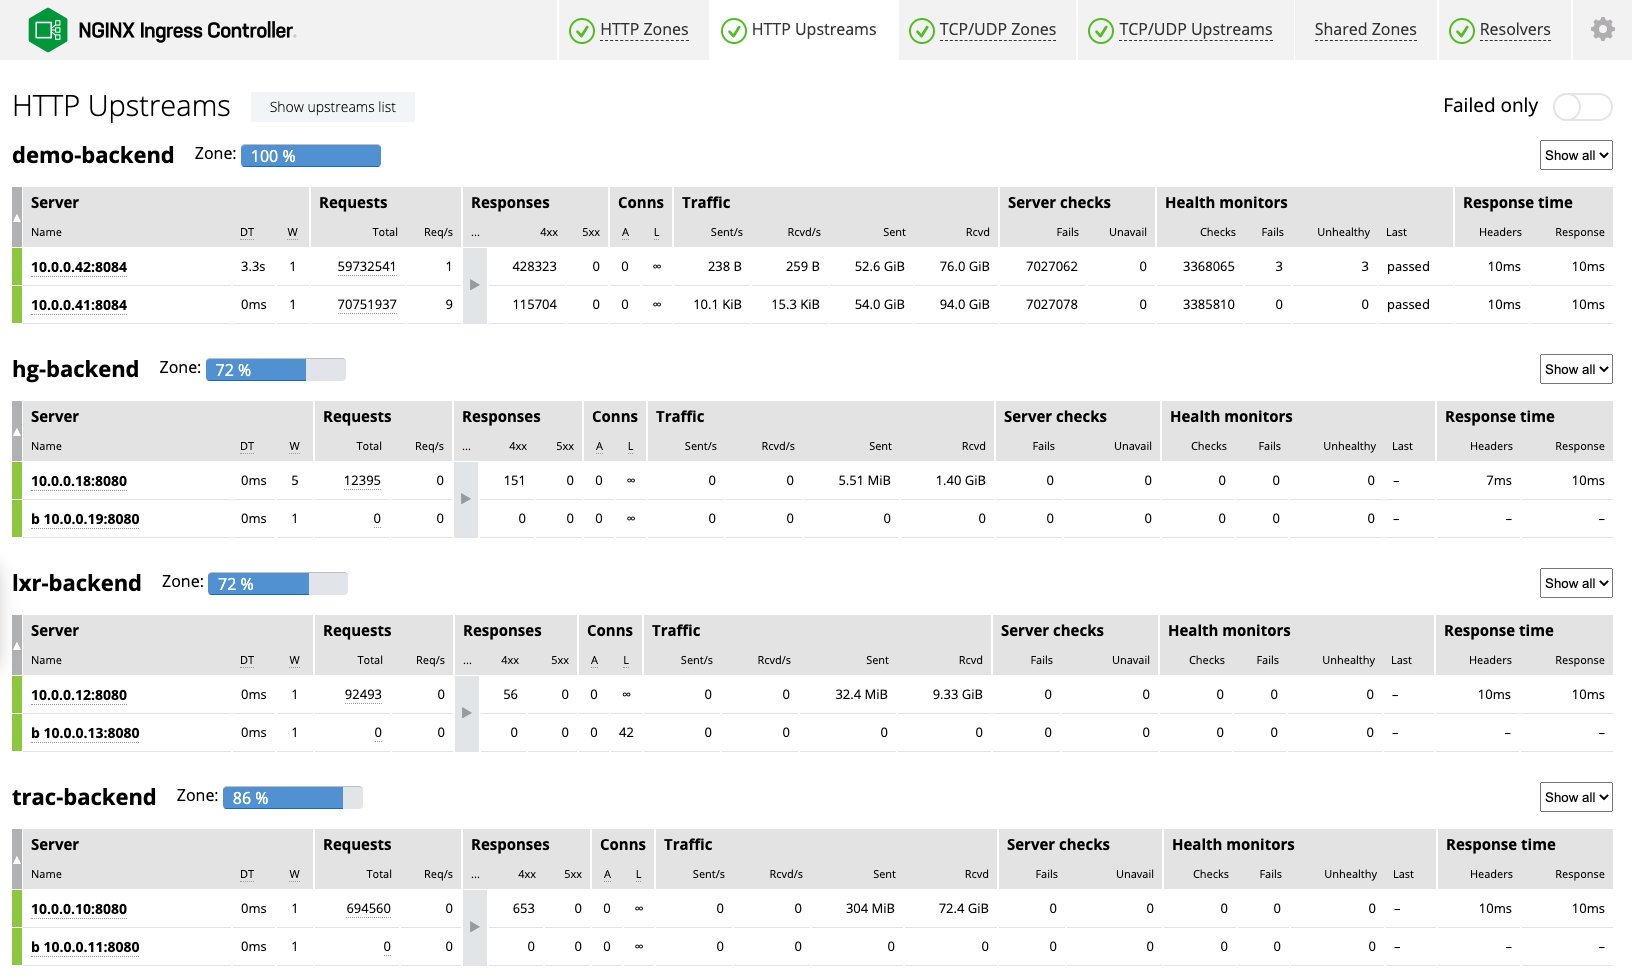
With NGINX Plus, the live activity monitoring dashboard, powered by the NGINX Plus API, displays hundreds of key load and performance metrics. Get fine‑grained detail down to the level of a single pod so you can quickly and easily measure response times to apps and diagnose the source of an issue. Should your Kubernetes environment grow, you automatically get dashboards for each additional NGINX Ingress Controller instance.As an example, two columns on the HTTP Upstreams tab give you an instant read on application and infrastructure status:
- Requests – If the number of requests per second (Req/s) are dipping below the norm for the given application (for example, 5 requests per second when 40 is normal), the Ingress Controller or application might be misconfigured.
- Response time – If response times are 10 milliseconds (ms) or less, you’re in great shape. Latency upwards of 30–40ms is a sign of trouble with your upstream applications.
- Stub status for NGINX Ingress Controller
With NGINX Open Source, NGINX Ingress Controller includes a status page that reports eight basic metrics. - OpenTracing with NGINX Service Mesh
NGINX Service Mesh supports OpenTracing with the NGINX OpenTracing module. As of this writing, the module supports Datadog, LightStep, Jaeger, and Zipkin.
Problem: My Cluster or Platform Is Running Out of Resources
Got HTTP errors? 503 and 40x errors indicate that there’s a problem with your resources, while 502s mean that a config change didn’t work. Use historical data to diagnose where you might be running out of resources.
- Logging with NGINX Ingress Controller
The first step in diagnosing network issues is to check out the NGINX Ingress Controller logs, in which every log entry is annotated with the relevant Kubernetes service. Entries about errors identify the associated service. The logs include detailed information about all the traffic that has come through the Ingress Controller, including a timestamp, source IP address and response status code. You can also export logs to popular aggregators such as Datadog, Grafana, and Splunk. -
Prometheus metrics
One of the NGINX Ingress Controller’s most popular features is its ever‑expanding list of Prometheus metrics, which include metrics on network performance and Ingress controller traffic. With NGINX Plus, the NGINX Ingress Controller exports metrics about connections, caching, HTTP and TCP/UDP traffic handled by groups of NGINX workers that share data in a memory zone, HTTP and TCP/UDP traffic handled by groups of backend servers, and more.NGINX Service Mesh deploys a Prometheus server that uses the NGINX Plus API to scrape metrics from NGINX Service Mesh sidecars and NGINX Ingress Controller pods. If you prefer to use an existing Prometheus deployment, we also provide scrape configurations to add to your Prometheus configuration file.
- Grafana dashboards
We provide official Grafana dashboards for NGINX Ingress Controller and NGINX Service Mesh that visualize metrics exposed by the Prometheus Exporter. Users value the granularity of the data, which includes detail down to the millisecond, day-over-day overlays, and traffic spikes. For example, the NGINX Service Mesh dashboard can indicate your pods are at capacity by displaying the amount of traffic on any one service or pod and the number of active pods being monitored.
Getting Production-Ready with NGINX
The production‑ready NGINX Ingress Controller (based on NGINX Plus) is available for a 30‑day free trial which includes NGINX App Protect to secure your containerized apps. The always‑free NGINX Service Mesh is available for download at f5.com.