This blog post is the fourth in a series about how to monitor NGINX and make the most out of your web delivery infrastructure with NGINX Amplify:
- Setting Up NGINX Amplify in 10 Minutes
- Improving Server Configuration with NGINX Amplify Reports
- Using NGINX Amplify Custom Dashboards and Filters for Better NGINX Monitoring
- Inside NGINX Amplify: Insights from Our Engineers (this post)
The public beta version of NGINX Amplify is now used on thousands of servers. Many sysadmins and DevOps personnel have implemented it in their development, staging, and production environments. Feedback has been very positive, but we are receiving many requests for more examples of how to use it in the real world.
We asked ourselves: who knows NGINX and NGINX Amplify the best? Well, it’s definitely our own DevOps professionals. So we interviewed two of our experienced operations engineers, Andrei Belov and Jason Thigpen. We asked them to describe how they configure NGINX and NGINX Plus for better monitoring and how they use NGINX Amplify.
Andrei Belov
Tell us a bit about your experience and background, before working at NGINX, Inc. and now.
Before NGINX, I worked at a medium‑size Internet service provider which also provided a wide set of hosting services, including a large shared‑hosting farm powered by Apache. I started as a tech support engineer and moved up to become a site reliability engineer [SRE], then a systems engineering manager. Now, at NGINX, I work with some of the largest cloud providers: building their load‑balancing systems, doing release engineering for NGINX Plus, and helping with DevOps tasks for NGINX Amplify infrastructure such as EC2, RDS, and Route 53.
Any interesting projects in your past?
[Open source] NGINX was launched in 2004, and we started to use it at my previous job around 2007. Before NGINX we were using the OOPS caching proxy server (unmaintained since early 2000s) in front of Apache 1.x. For the first step of NGINX adoption, we put NGINX as a reverse proxy in front of Apache, gradually replacing our OOPS accelerators with NGINX. Then, we started to serve static files with NGINX, in order to further speed up the delivery of hosted websites.
The third step, which I led, was porting mod_aclr to support Apache 2.x which we’d just started to use back then, and embedding it in our setup. Apache behind NGINX receives the request, and if the request is trying to get a static file, Apache stops request processing, returning the response header X-Accel-Redirect back to NGINX along with the file location. NGINX then serves the file to the user. That tremendously offloaded our hosting machines’ resources and basically saved us at times of peak load. Another thing that helped us was the support for keepalive to upstreams behind NGINX.
How did you monitor servers in the past?
Years ago, we used our own set of scripts, custom built for the task. We were taking stats and metrics from the machines, switches, and routers in our own data center using SNMP, then feeding it into a central database with a simple but quite functional web frontend.
What qualities are necessary for a good monitoring system?
Minimum false positives and ease of use.
When did you join NGINX?
Three months after it became a company, five years ago.
You’ve been with NGINX Amplify project since its very beginning. What is the history of its software stack?
That was an interesting development. After a set of whiteboarding sessions we implemented a prototype in an on‑premises virtualization system. Then we quickly moved everything to EC2. The requests are now resolving through Route 53, then going to an NGINX Plus load‑balancing layer. We use NGINX Plus everywhere in the stack. I work most frequently with the backend receiver services and with the application deployments. NGINX does not require a lot of attention; it just works. It only needs to be monitored properly.
How was your monitoring implemented? What did you try to use, what worked and what did not?
At the very beginning of the project, monitoring was not implemented. Once the infrastructure started to grow, several months before public beta, we added different monitoring systems. NGINX Plus live activity monitoring was used together with them. All these tools provide views on NGINX Plus status, with longer retention time.
How did you start using NGINX Amplify for monitoring?
When the NGINX Amplify Agent became available, we installed it immediately in the developer stack. We wanted to start using it ourselves as early as possible. With the release of private beta, we started to use it in the production stack.
Which graphs do you usually look at?
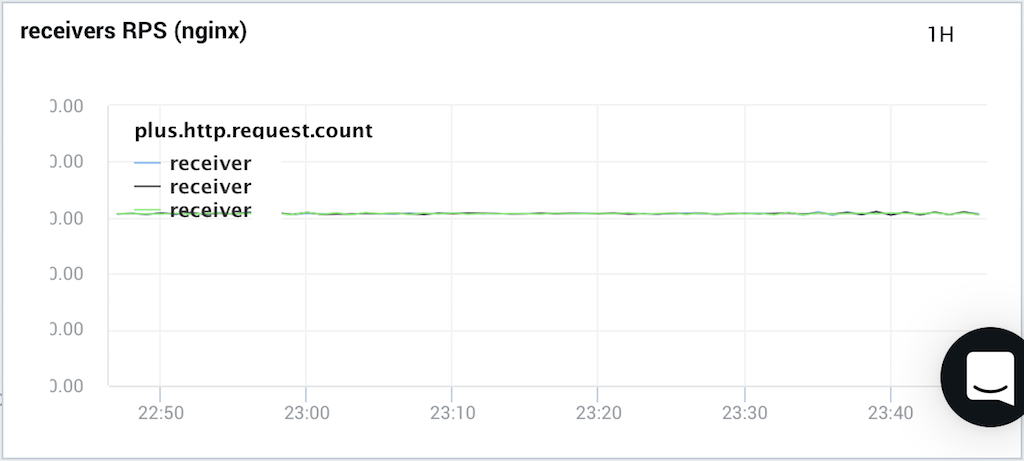
It depends on the situation. Most frequently I look at requests per second, network traffic, connections per second, and NGINX upstream errors.
Has NGINX Amplify helped you during an outage?
We recently had an interesting situation. We usually have the NGINX Amplify Agent running together with another monitoring system agent, which monitors the system metrics. Last month, one server started to appear offline in that monitoring system for no apparent reason. The server was working, but the monitoring agent failed.
In order to understand why the agent was not working correctly, we created a custom dashboard in NGINX Amplify. We collected every possible system metric, including IOWait, iostat, and network metrics, and started looking for abnormalities. We found a correlation between metrics: every time the service appeared down, we had a burst in IOWait. That information helped us troubleshoot the cloud storage issues that were occurring.
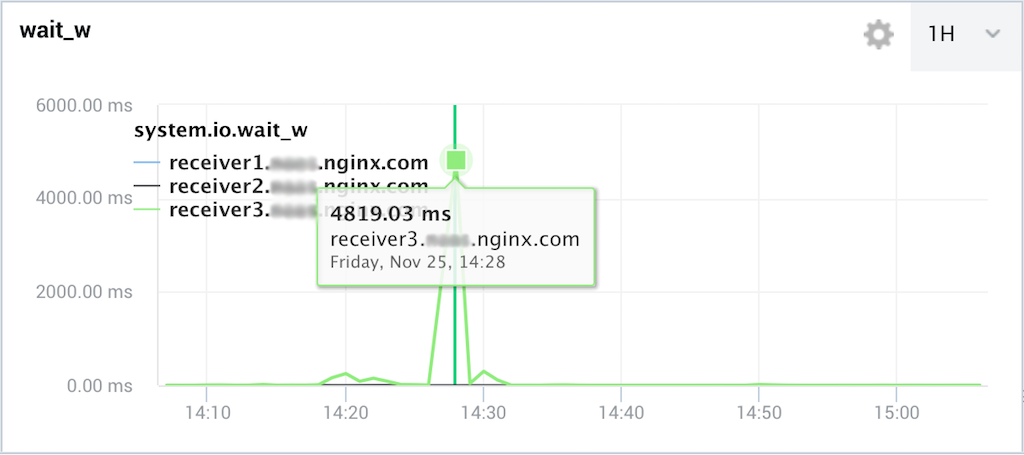
IOWait timeWhich system tools do you usually run during troubleshooting?
Depends on the situation. Generic system tools: vmstat, iostat, ps, top. Network tools: netstat, ifstat, ss, tcpdump.
What do you find especially useful in NGINX Amplify?
Definitely the custom dashboards and custom graphs. Sometimes I need to monitor something very specific. Let’s say there’s something wrong with the server, and I need to find out the cause of the issue. Now I can make my own dashboard with graphs on anything. This helps me in detecting anomalies and finding the root cause of the issues.
What are you going to research more in NGINX Amplify? How are you going to extend its use for your systems?
I definitely want to research filters further. I think they provide an exceptional level of detail and are likely to become critical for complex troubleshooting.
Jason Thigpen
Tell us a bit about yourself. What’s your background and how did you start using NGINX?
I would describe myself as an “infrastructure automation enthusiast”. Generally my roles have focused on building out infrastructure and automating management of it. Not necessarily “set up 12 servers”, but rather “ensure we can easily and automatically create and destroy infrastructure resources on demand”.
In the early 2000s I was the Systems Engineer for a graduate program at a university where I inherited an infrastructure consisting of beige box PCs stacked on wooden shelves. I quickly acquired an old server rack from another department and built out a stack of redundant rack‑mounted hardware. I virtualized everything on Xen, focusing on wrappers around common administration tasks giving me the flexibility to build out internal web tools primarily in PHP, Python, and Ruby/Rails behind NGINX.
As AWS gained popularity, more people became interested in “the cloud” – AKA “someone else’s computer”. I gained a lot of experience consulting on many on‑site–to–cloud migrations over the years. I then spent some time working for an employer with one of the largest data‑center footprints. Through that combination of experience, I have established a vocabulary for defining network resources that can apply to both data‑center and cloud resources. Ideally, I wanted to make those resources more agnostic to the platform.
What makes working on NGINX Amplify project interesting?
I have always had an interest in building a business on top of open source software and the communities behind it. NGINX fits that vision perfectly. In the NGINX Amplify team, we are constantly dealing with the challenge of scaling a production infrastructure from scratch to meet the demands of our growing customer base. This also gives us an opportunity to demonstrate best practices for how to run a software as a service (SaaS) product.
Can you describe the software stack of NGINX Amplify?
We run NGINX at every layer of our stack. That starts with our load‑balancing layer at the edge, routing traffic to frontend and backend services. We also run NGINX in front of each application server as a local reverse proxy. Frontends and backends are distributed across multiple availability zones for redundancy and high availability.
Do you run NGINX Amplify Agent in the stack?
We have run NGINX Amplify Agent on all nodes from day one. NGINX Amplify complements NGINX to the point that I see no reason not to run it next to every instance. You get a central location for visibility into what’s going on with your NGINX deployments and how that correlates to other system metrics.
Can you describe your day‑to‑day monitoring activities? What are you looking at?
Thankfully, I joined after Andrei and others had put together some really great overview dashboards. Among other things, one of our “go to” dashboards covers requests per second, amount of traffic sent and received, and counts of response status codes at every layer of our stack. Using filters, we can get even more granular insight into exactly which response status codes we’re returning.
Any interest in system‑level metrics: CPU, RAM, disk I/O?
I think system metrics are interesting as correlations to other NGINX metrics. We get them with the NGINX Amplify Agent, and it helps us paint the whole picture of what might be happening at any given time.
Do you predict trends with NGINX Amplify?
Today, this largely depends on existing known trends. Since NGINX Amplify is a new product, we often have limited long‑term data. However, based on historical experience we look at time periods that we consider “good” or “bad” and set thresholds for new NGINX Amplify alerts. That feedback helps inform decisions for new graphs and filters that we can use in more meaningful ways.
What special systems do you use for alerting?
We use NGINX Amplify alerts to send emails as we reach warning level thresholds. We send similar critical level alerts to our on‑call escalation service, PagerDuty.
How critical is a server failure?
A well‑architected infrastructure should handle a single host failure seamlessly, and ours is no exception. Our NGINX Plus load‑balancing tier is key to handling a dynamic infrastructure. For instance, if we see a backend host behaving badly, we can quickly and easily prevent it from accepting production traffic and replace it with a new healthy instance using the upstream_conf interface [Editor – This interface is replaced and deprecated by the NGINX Plus API in and later].
How do you do that?
We primarily use SaltStack for infrastructure orchestration. At the simplest level, you can target your upstream load balancers with the Salt execution module http.query, with a query to the appropriate NGINX Plus API endpoint. Ideally, you utilize the Salt Reactor system to act on events triggered by beacons.
Did you have events where you had a server failure and had to use your monitoring tools? What did you do then?
One memorable issue was surfaced through the monitoring of our message queueing and background jobs clusters. The NGINX Amplify Agent gave us the system‑level metrics that we further used for alerting. What we don’t want to see is alerting from customer emails. We expect our infrastructure to alert us before our customers notice anything.
What do you usually look at in case of performance degradation?
We start with the overview dashboards that we have configured in NGINX Amplify, looking for quick and obvious visual correlations. This will usually highlight a host or a service spike in some metric, whether it is requests per second, CPU usage, or errors. Then we take that service or host out of its respective load‑balancing pool for forensics and manual maintenance. As described above, we can also spin up a replacement machine while we continue tracing the issue with the failed server.
Which specific NGINX Amplify metrics and dashboards have been particularly helpful to you?
I remember we began seeing an increase in the nginx.http.status.5xx metric for one of our services. We needed to narrow those down to understand which errors they were; we return a few different application level response status codes for different reasons. For that, using filters to split those into multiple metrics allowed us to create graphs comparing more specific application errors. This showed us that the increase in application errors was related to failed database connections. Using this new insight we discovered an issue with our database hosting provider that we were able to troubleshoot and resolve with them.
What tools do you run in order to troubleshoot issues?
Tracing tools, tcpdump/Wireshark. Many parts of the system tools output are presented in the dashboards already, so we only need to narrow things down to a particular service on the server and troubleshoot it. The logs of the service usually help a lot. Then we may take traffic captures with tcpdump, or even debug the application itself. Sometimes the problem is system‑level, and iostat together with other tools can be helpful.
Which features of NGINX Amplify are you planning to research more and implement later?
I find filters really interesting. I really like the idea of applying filters to some metrics, and I want to understand them better. It is a very powerful tool that we plan to use extensively.
Conclusion
NGINX Amplify is proving its value in our own stack here at NGINX and for thousands of our customers as well. Download the NGINX Amplify public beta and try it yourself today.