

This post is adapted from a webinar by Faisal Memon and Nick Shadrin. This post covers the first part of the webinar, an overview of the features and capabilities of NGINX Amplify. To see the second part, a live demo, watch the complete webinar on demand (the demo begins at 13:20).
Also check out the many other posts about NGINX Amplify on the blog.
Table of Contents
0:00 Introduction

Faisal: Today we’ll be talking about NGINX Amplify, our new tool for monitoring NGINX.
My name is Faisal Memon and I do product marketing here at NGINX. I’ve been doing this job for about a year now, and prior to this role I worked as a technical marketing engineer at Riverbed. Prior to that I spent about eight years at Cisco writing software.
Here with me today is Nick Shadrin and he’ll be on later on to do a live demo.
00:39 About NGINX and NGINX Plus
Both Nick and I work for NGINX, the company behind the popular open source web server, load balancer, content cache and just all‑around great multipurpose tool that today is used by more than 350 million websites worldwide. NGINX has seen tremendous growth over the last few years. In the past year alone it has grown 37% in usage as a web server.
NGINX was originally created by Igor Sysoev back in the late 1990s/early 2000s to handle the onslaught of new users that he and other website owners were experiencing as the Internet became much more mainstream during that timeframe. The late 1990s/early 2000s is the time when my parents first went online, and I think the time that many people first really discovered the Internet and first really started using it on a day‑to‑day basis.
The company NGINX, Inc. was founded in 2011 by Igor and a few other colleagues. Since then, we have put out a commercial product, NGINX Plus, and we have secured over $40 million in total funding.
2:04 Why Visibility Matters
I want you guys to imagine yourself in charge of a website that has crashed.
As the person responsible, you are under the gun. Customers are unhappy because they’re not able to get the functionality that they rely on. Management is unhappy because they’re losing money – they’re losing customers every single second that the website is down.
The only thing that can help you, in that crisis situation, is having visibility into your infrastructure and having ready access to data in a way that you can easily consume. That’s why NGINX is one of the most critical components within the infrastructure of a lot of organizations today.
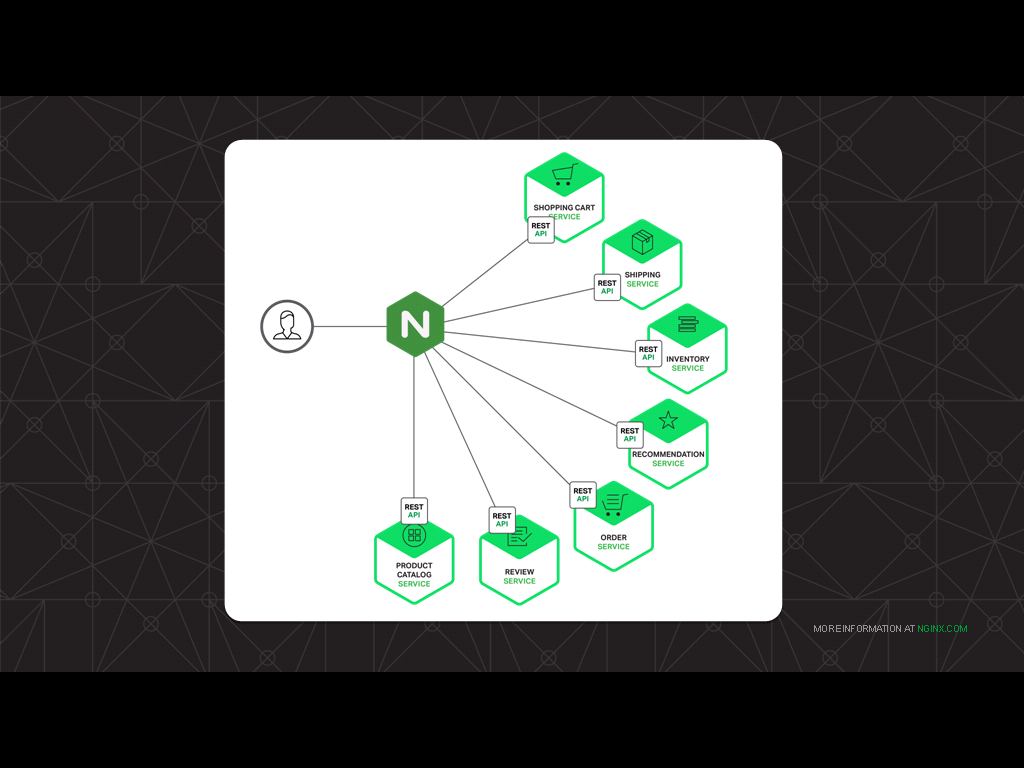
You can see in this diagram of a microservices‑based architecture, the microservices as well as the clients are all connected to NGINX.
This unique vantage point means NGINX sees all traffic going in and out of the application. This allows for a lot of insights on application health as well as application performance.
There are a lot of monitoring tools out there that organizations are using, and a lot of organizations are using multiple monitoring tools. We think that NGINX Amplify is a nice complement to that, providing additional functionality and additional visibility that you might not get with those tools.
3:48 NGINX Amplify Monitors NGINX in Real Time, Analyzes Configuration, and Sends Alerts
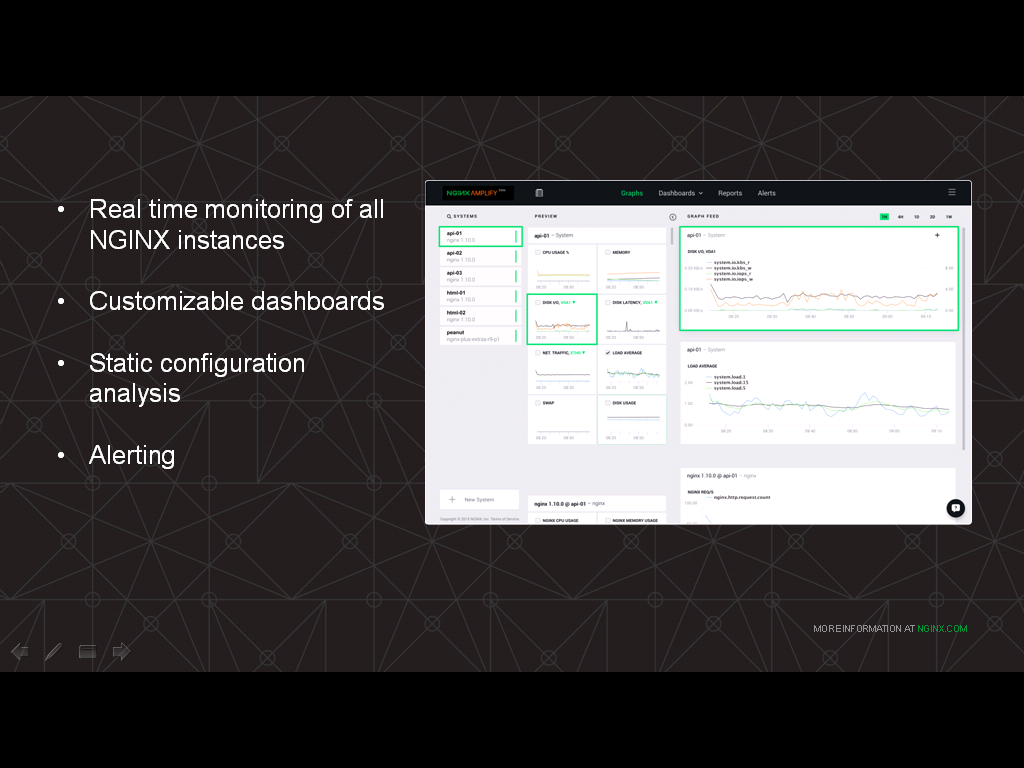
This is a screenshot of NGINX Amplify. You can see it provides interesting functionality and useful features that I think help not just with debugging applications when they’re down, but also with day‑to‑day monitoring of performance and health as well.
NGINX Amplify provides real‑time monitoring of all NGINX instances. That lets you view metrics from every NGINX server or server instance that you have deployed within your organization and within your infrastructure, all under a single pane of glass.
You can monitor NGINX performance in terms of requests per second and various other metrics, as well as errors that NGINX has seen coming from the backend application service.
You can create customizable dashboards with NGINX Amplify, so you can combine all the metrics that are important to you, and to your organization and to your job, and put them all on a single page for easy access. For example, if your website is down, you can have all your errors on one page to let you easily get to that.
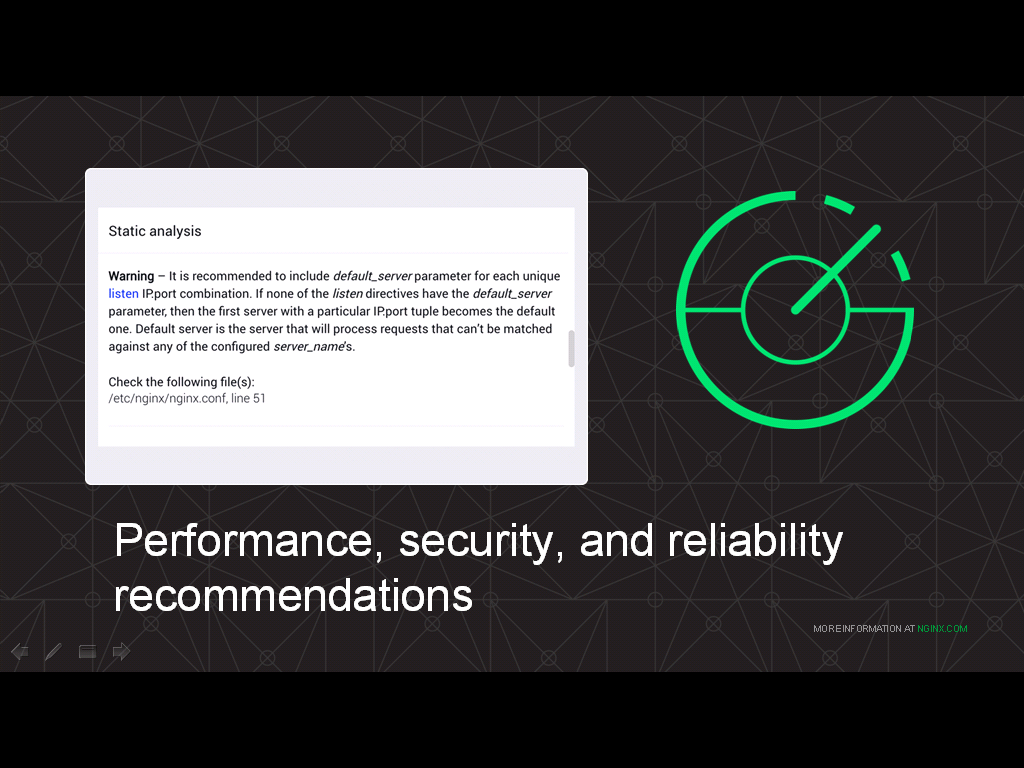
NGINX Amplify also performs static configuration analysis. This is where NGINX Amplify monitors NGINX, analyzes the configuration – searching for potential gaps in terms of performance, security, and reliability – and then makes recommendations to improve and fill in those gaps.
Finally, NGINX Amplify provides alerting. So, it can alert you, for example, if you’re seeing a high volume of 404 errors or 500‑series errors. NGINX Amplify, at that point, can send you an alert.
5:54 NGINX The NGINX Amplify Agent and UI
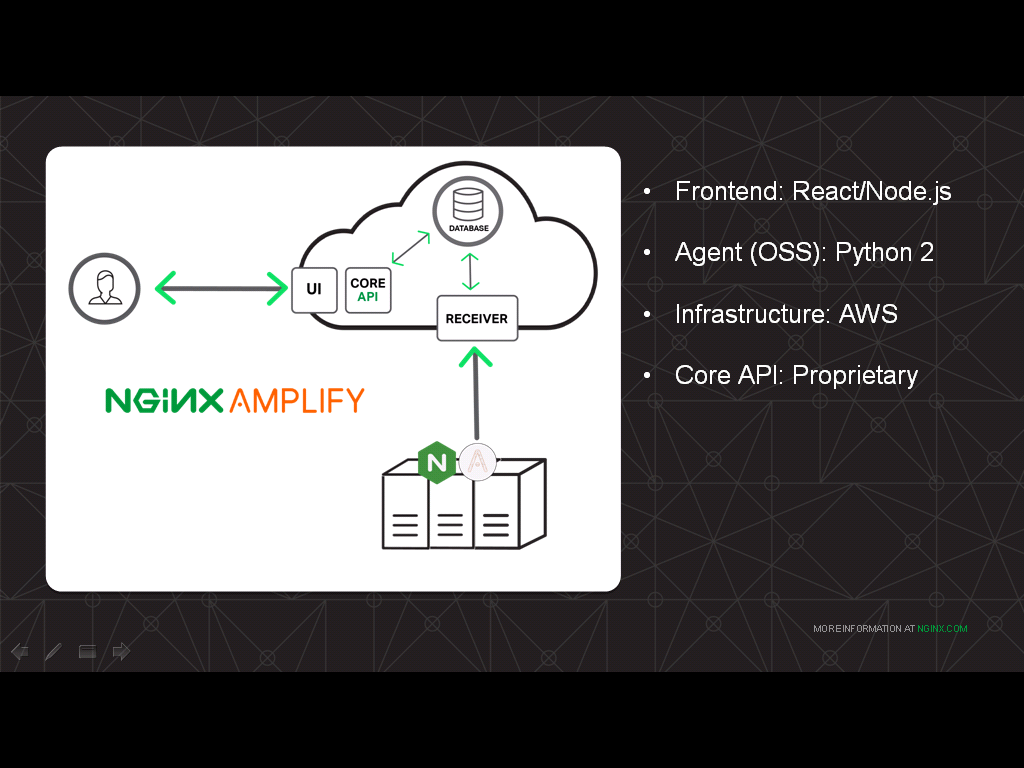
NGINX Amplify is a highly scalable service built on modern components. It works by way of a small Python‑based agent that you install alongside NGINX. That can be on a bare metal server, or that can be within a container, however you have NGINX deployed. You install the agent alongside it.
The agent itself is fully open source and is available on the NGINX, Inc. GitHub site. The agent feeds into a receiver which collects all the data and then stores it into a database, and that’s how the backend of the data collection works.
On the frontend, our UI is composed of React.js and Node.js, and it talks to a proprietary core API which pulls the data from the database that was populated by the agent.
Our infrastructure is hosted entirely on AWS.
7:07 NGINX Amplify Is in Free Public Beta
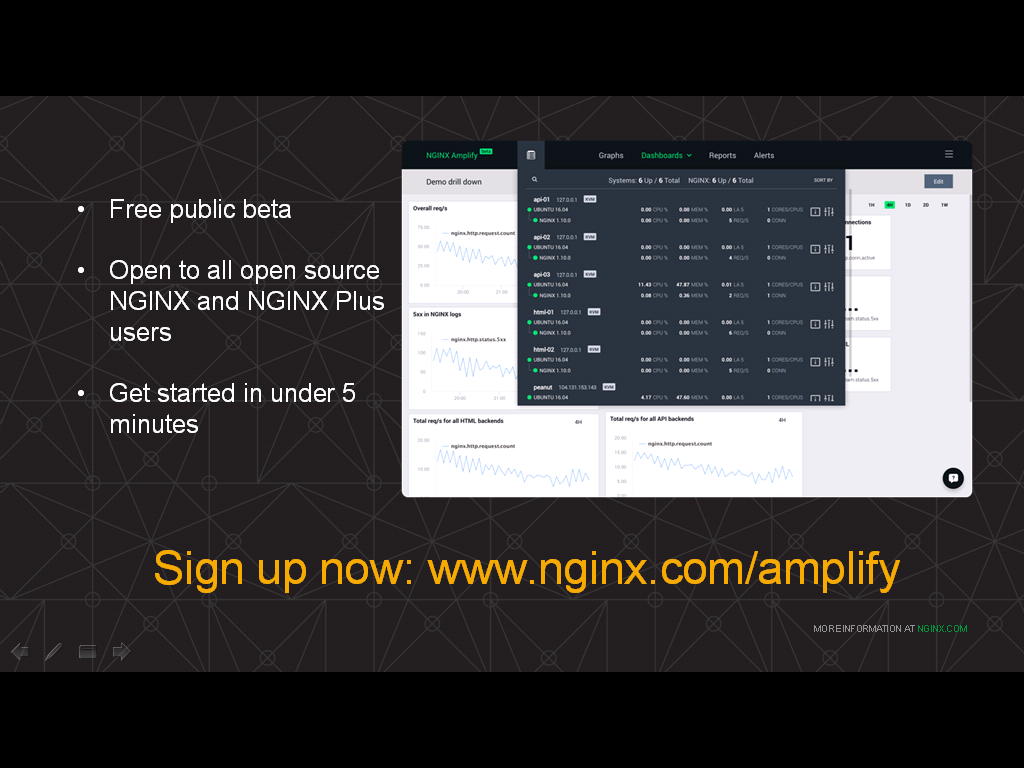
How much does NGINX Amplify cost? Right now, it’s free. We are currently in a free public beta of NGINX Amplify and we are making it available to all users of open source NGINX as well as our commercial NGINX Plus customers.
NGINX Amplify is something that we have been working on internally for a very long time and we are thrilled that we were able to announce it last September at our annual user conference, nginx.conf 2015.
From that time until last month, NGINX Amplify was in private beta.
During the private beta, the users who tried it out really liked it. They were able to instantly and immediately gain value from it and use it to solve immediate issues that they were having.
Seeing this valuable feedback from those who tried it out early gave us the confidence to release NGINX Amplify as a public beta last month. Now it’s at a point where we are encouraging all users to try it.
It’s extremely easy to get started monitoring NGINX with NGINX Amplify. It only takes 5 minutes, really, to get started. Just check a few things, then install the agent on your servers. Once that’s installed, you’ll start to see metrics populate within a few minutes.
8:40 NGINX Amplify Recommends Configuration Improvements
Let’s dive a little bit more into the features of NGINX Amplify.
As I mentioned earlier, NGINX Amplify does static analysis of your configuration as well as monitoring NGINX in realtime. As you can see on the screenshot, it provides a nice, very detailed analysis and gives recommendations. It gives you a detailed description of the problem as NGINX Amplify sees it, as well as a line number in the configuration to go and look at.
In this particular case, NGINX Amplify is pointing out that the default_server parameter to the listen directive is not set, which is something that’s very easy to skip over during your development, but something that can cause problems later on.
If that default_server parameter is not included and NGINX gets a request for a server that is not configured, it will just take the first server configuration file – which may or may not be what you want – and so having that parameter set is really good for predictability.
While monitoring NGINX, NGINX Amplify also provides recommendations around performance. If you are, for example, disabling buffering or doing other things that might impact performance, it will point that out along with what you may have intended to do.
It also provides security recommendations. For example, if you’ve opened up your metrics to the general internet, NGINX Amplify will catch that and point it out.
10:12 Detailed Metrics for Monitoring NGINX
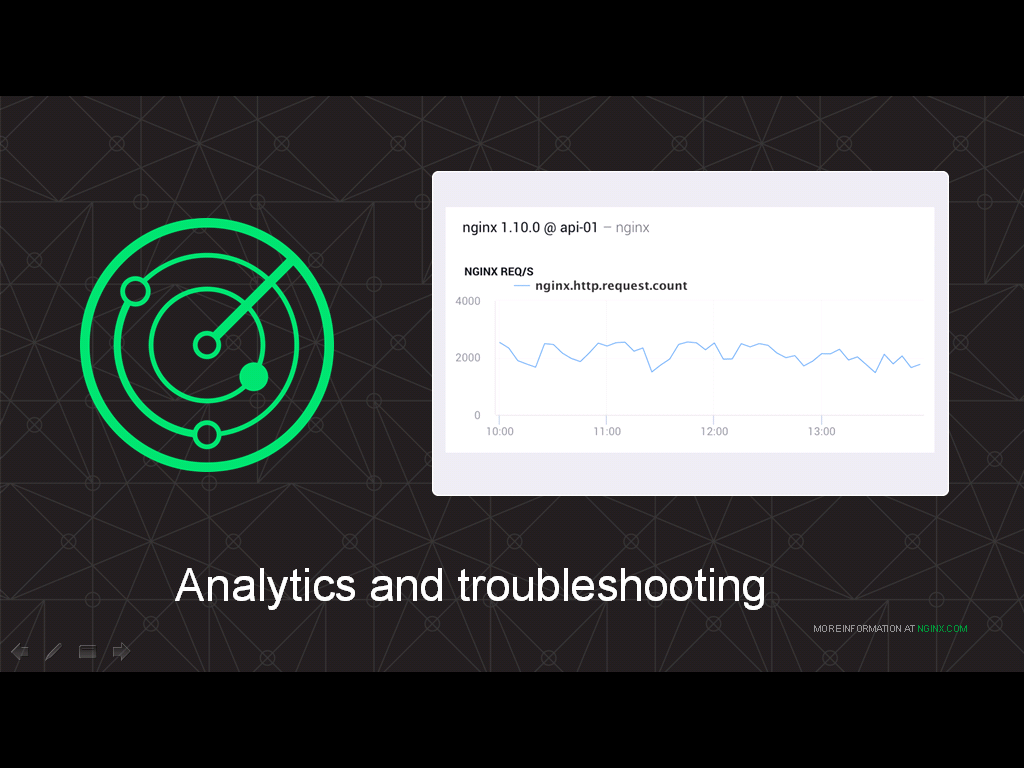
As we mentioned earlier, NGINX Amplify collects metrics from all of your NGINX instances and provides it to you within a graphical dashboard.
Those metrics can be aggregated. You can see, for example, overall throughput, overall requests per second, or just in general, overall performance across your entire application. Or you can kind of drill down and see how each of your API endpoints are performing. You can also see graphs of errors, you can see graphs of 404 errors, you can see graphs of 500‑series errors.
So, you can really drill down and find out what’s really going on within your application from the point of view of NGINX.
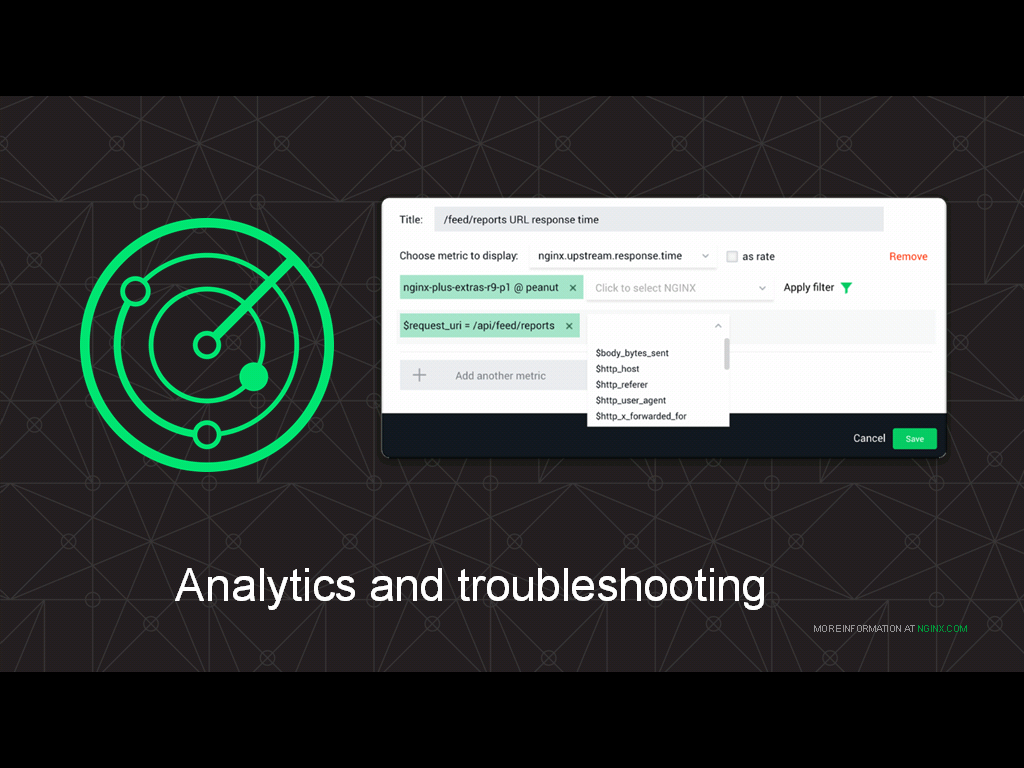
NGINX Amplify has a very powerful interface for designing graphs. In this particular instance, we are defining a graph to monitor particular API endpoints. You can see here a bunch of drop‑downs so you can, for example, filter that by user agent, filter that by the original IP address of the client, and a bunch of other data that is collected from NGINX, as well as from the log files that NGINX outputs. That means that NGINX Amplify is able to parse NGINX logs and pull out the data in those logs, and present that to you in a graphical format.
So, this is a very nice alternative to actually going in there and digging into the log files. Now, you can use NGINX Amplify to do that instead.
11:55 NGINX Amplify Sends Customized Alerts
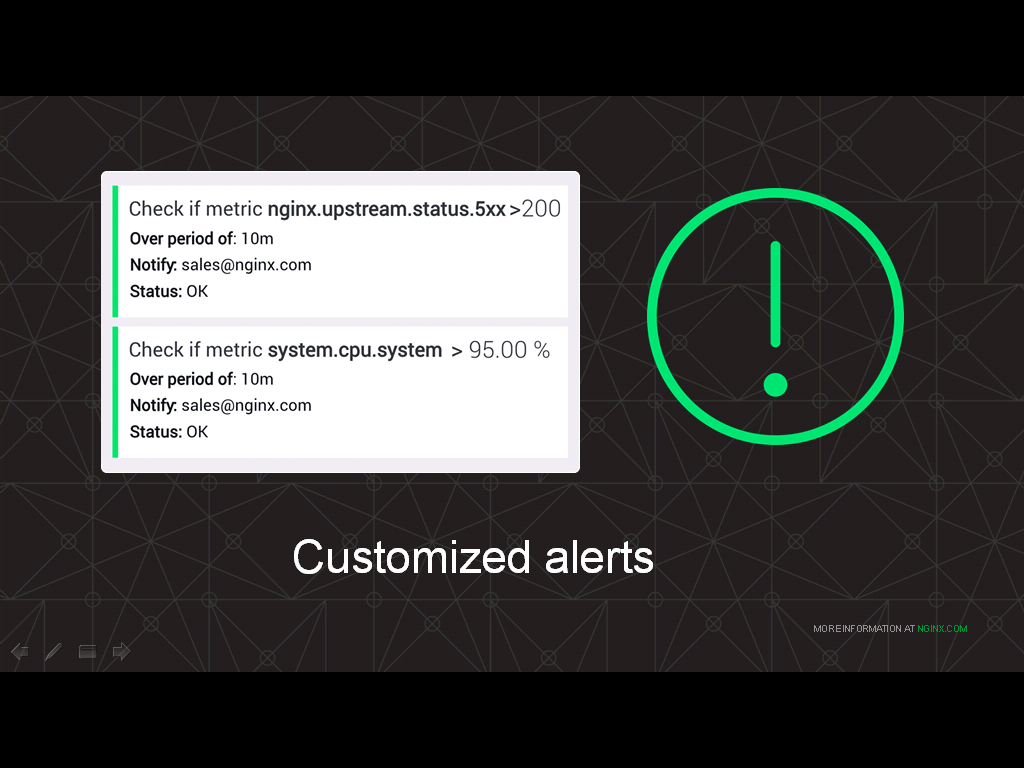
NGINX Amplify also does alerting. So rather than polling and constantly checking the UI, it’s great to have something that alerts you when something is wrong. NGINX Amplify is able to do that.
You can see here on the screenshot that – if we are seeing, for example, a large number of 500‑series errors, over 200 within a 10‑minute time frame, NGINX Amplify will send a notification to the email specified.
And you can define metrics across all kinds of conditions. The other one that’s here is if your CPU is at 95% for more than 10 minutes, your server’s probably overwhelmed, maybe handling too much traffic, and NGINX Amplify will send you an alert.
After the initial alert that NGINX Amplify sends you, it will send a digest of active alerts on a 30‑minute basis so that you’re not constantly flooded in your inbox with alerts.
If an alert is not important to you, you can of course go to the UI and mute that alert.
That’s a very high‑level overview of how to monitor NGINX with NGINX Amplify.
This post is adapted from a webinar by Faisal Memon and Nick Shadrin. This post covers the first part of the webinar, an overview of the features and capabilities of NGINX Amplify. To see the second part, a live demo, watch the complete webinar on demand (the demo begins at 13:20).
Also check out the many other posts about NGINX Amplify on the blog.
Try out NGINX Amplify for yourself and let us know what you think – sign up for the free beta today.