This blog post is the third in a series about how to monitor NGINX and make the most out of your web delivery infrastructure with NGINX Amplify:
- Setting Up NGINX Amplify in 10 Minutes
- Improving Server Configuration with NGINX Amplify Reports
- Using NGINX Amplify Custom Dashboards and Filters for Better NGINX Monitoring (this post)
- Inside NGINX Amplify: Insights from Our Engineers
In another recent blog post, we introduced and briefly described custom dashboards. This blog post describes how you can use custom dashboards and filters to focus in on the metrics that most exactly indicate how well NGINX and your applications are functioning. By alerting you of potential outages and performance bottlenecks, the improved monitoring data helps you improve uptime and NGINX performance.
Architectural Components of NGINX Amplify
The dashboards and filters in NGINX Amplify interact with these other NGINX Amplify components:
- NGINX Amplify Agent – A lightweight software client that you install alongside your NGINX and NGINX Plus instances. The Agent, which is open source, Python‑based software, collects metadata and metrics from the operating system, and all metrics available from NGINX.
- NGINX Amplify Receiver – Located in the cloud and managed by NGINX, Inc.
- NGINX Amplify Web UI – Located in the cloud and managed by NGINX, Inc.
For a more detailed description of NGINX Amplify’s architecture, see Improving Server Configuration with NGINX Amplify Reports.
Metric and Metadata Collection
[Editor – This section has been updated to use the NGINX Plus API, which replaces and deprecates the separate Status module discussed in the original version of the post. In NGINX Amplify 1.2.0 and later, the Agent behaves as described here.]
The NGINX Amplify Agent collects metrics from several sources.
-
System‑level tools provide data about CPUs, disk, and networking via the
/procfilesystem andsysfs. NGINX Amplify Agent collects the data using thepsutillibrary.System metrics are prepended with the word
systemin the NGINX Amplify metric list. Examples of system metric names includesystem.cpu.user,system.disk.free, andsystem.net.bytes_sent. -
The
stub_statusinterface (Stub Status module) provides HTTP access to a set of general NGINX metrics, including the number of active connections and requests. You can see sample output here. To make this page available in your NGINX environment, include thestub_statusdirective in the configuration. -
The NGINX Plus API (API module) provides additional metrics for NGINX Plus users. You can explore the API using Swagger here.
Note: As noted above, the NGINX Plus API replaces and deprecates the Status module that formerly generated these metrics. For backward compatibility, NGINX Amplify uses the metrics from the Status module if it is enabled (with the
statusdirective) and the API is not.Metrics that are exclusively available in NGINX Plus are prepended with the word
plus, for exampleplus.cache.hit.bytes,plus.http.status.2xx, andplus.upstream.fails.count.
Note: When the NGINX Amplify Agent parses NGINX configuration files, it looks for the location blocks where the stub_status and api directives are included, and verifies that it can access the corresponding URLs via HTTP. For example, with the following configuration, the Agent requests NGINX Plus metrics from http://status.example.com:8070/status_info:
server {
    listen 8070;
    server_name status.example.com;


    location /status_info {
        api write=on;
        allow 127.0.0.1;
        deny all;
    }

    # ...
}
Make sure that the server_name and location directives are properly configured and grant localhost access.
Log Collection
Log files provide the most precise information available, and for every request processed by NGINX. Custom log formats can include additional variables related to both requests and responses.
The NGINX Amplify Agent parses the configuration files to find the access_log and log_format directives. It understands the log format for multiple NGINX configuration files and properly assigns logged values to the variable names.
The following sample log_format directive includes variables related to request and response times, in addition to the variables from the default combined format:
log_format extended_with_variables '$remote_addr - $remote_user [$time_local]"$request" $status $body_bytes_sent "$http_referer" "$http_user_agent" rt=$request_time rt="$upstream_response_time"';The NGINX Amplify Agent opens log files and collects aggregated metrics in real time, as lines are being added to the files.
Syslog Collection
What if you cannot store logs in local files? Reasons for this may include:
- High number of HTTP requests
- Slow disk arrays
- Remote file systems
NGINX can send logs to syslog servers. The NGINX Amplify Agent can accept syslog messages directly from NGINX, effectively acting as a syslog server.
Follow these instructions to configure the syslog functionality of the NGINX Amplify Agent:
-
Make sure you are using NGINX version 1.9.5 or later (or NGINX Plus Release 8 or later). The latest version or release is always preferred (for NGINX, the latest mainline version).
-
Edit the NGINX Amplify Agent configuration file, /etc/amplify-agent/agent.conf, and specify the address and port that you want to use for the syslog listener:
[listeners] keys = syslog-default [listener_syslog-default] address = 127.0.0.1:13579 -
Restart the NGINX Amplify Agent to have it reparse the configuration and start listening on the specified IP address and port.
$ service amplify-agent restart -
Edit the NGINX configuration file and specify the syslog listener address as the first parameter to the
access_logdirective. Include theamplifytag, and your preferred log format:access_log syslog_server=127.0.0.1:12579,tag=amplify,severity=info extended_with_variables;Note: To send the logs to both the existing logging facility and the NGINX Amplify Agent, include a separate
access_logdirective for each destination. -
Reload NGINX:
$ nginx -s reload
Custom Dashboards
The NGINX Amplify Web UI enables you to create custom dashboards where you can display only data you have identified as critical, or the data related to a specific server, application, or deployment. You can create a dashboard using the Dashboards menu item in the top navigation bar.
A dashboard can display graphs and current values of any of the metrics collected by the NGINX Amplify Agent.
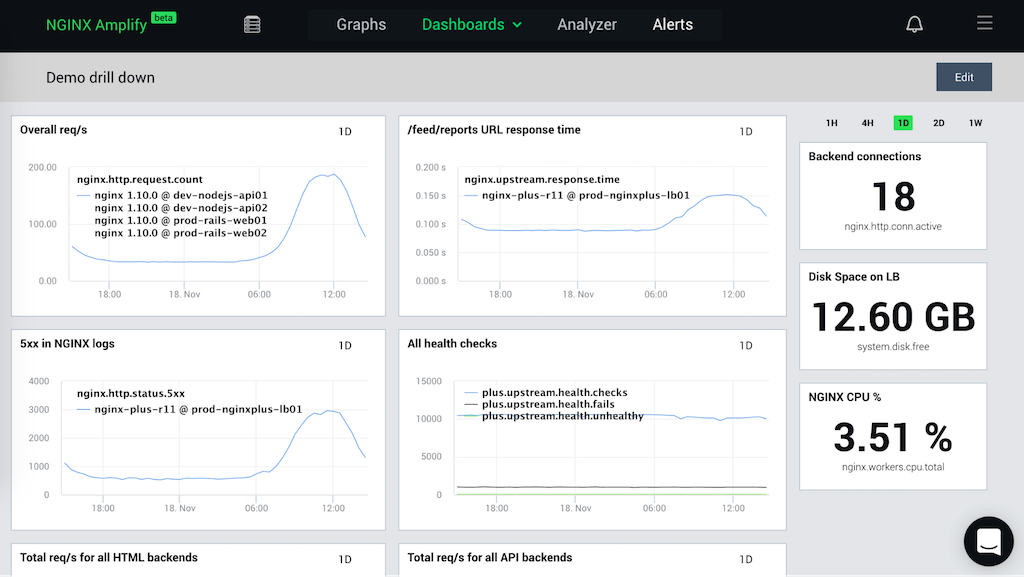
Dashboards can be fully customized. Click the Edit button in the top right corner to add, remove, or modify graphs and values. You can drag and drop items in the dashboard:

When you add a graph, you need to specify a name and a metric that you want to display. You can add multiple metrics to the same graph.
Each metric that you specify can be displayed for the aggregate of all NGINX instances or a subset of NGINX instances. If you use NGINX Plus with live activity monitoring, for metrics related to server zones or upstream zones you can drill down to the specific zone, as shown in this screenshot:
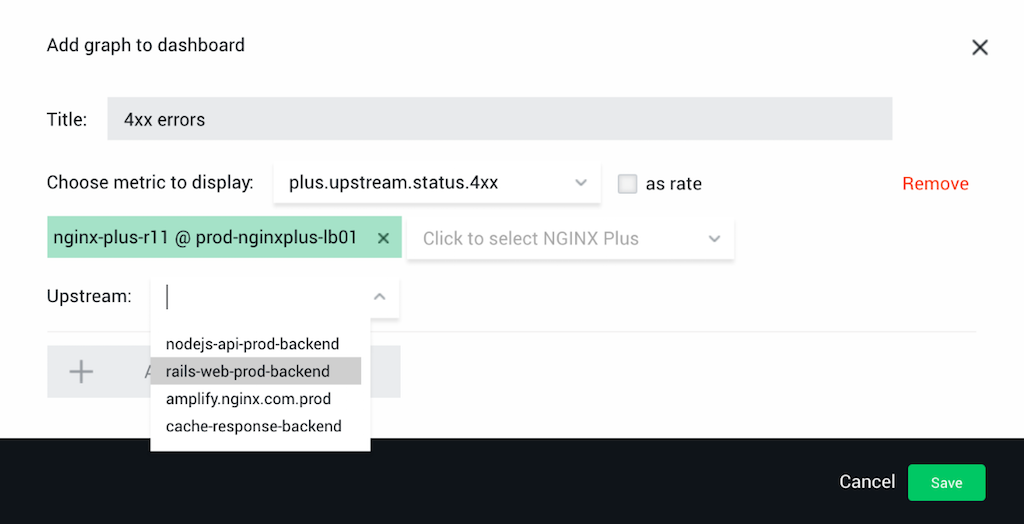
To finish adding or modifying the graph, click the Save button in the dialog box and then the Done button in the top right corner of the dashboard.
Filters
Filters allow you to apply additional matching conditions that a metric must meet to be collected. When a filter is applied, the metric is collected and aggregated into the custom dashboard graph or value only when the filter conditions are met. Filters are an additional custom dimension to a metric.
Filters can only be added to metrics collected from NGINX logs. You cannot assign a filter to a metric that was aggregated by NGINX itself, such as ones from the NGINX stub_status interface or the NGINX Plus API.
NGINX has a pre‑defined log format called combined. As of today, when you use this log format, the following metrics support filters:
nginx.http.method.delete |
nginx.http.status.2xx |
nginx.http.method.get |
nginx.http.status.3xx |
nginx.http.method.head |
nginx.http.status.4xx |
nginx.http.method.options |
nginx.http.status.5xx |
nginx.http.method.post |
nginx.http.status.discarded |
nginx.http.method.put |
nginx.http.v0_9 |
nginx.http.request.body_bytes_sent |
nginx.http.v1_0 |
nginx.http.request.malformed |
nginx.http.v1_1 |
nginx.http.status.1xx |
nginx.http.v2 |
You can enable the following additional metrics by using a custom log_format:
nginx.cache.bypass |
nginx.upstream.header.time |
nginx.cache.expired |
nginx.upstream.header.time.count |
nginx.cache.hit |
nginx.upstream.header.time.max |
nginx.cache.miss |
nginx.upstream.header.time.median |
nginx.cache.revalidated |
nginx.upstream.header.time.pctl95 |
nginx.cache.stale |
nginx.upstream.next.count |
nginx.cache.updating |
nginx.upstream.request.count |
nginx.http.gzip.ratio |
nginx.upstream.response.length |
nginx.http.request.bytes_sent |
nginx.upstream.response.time |
nginx.http.request.length |
nginx.upstream.response.time.count |
nginx.http.request.time |
nginx.upstream.response.time.max |
nginx.http.request.time.count |
nginx.upstream.response.time.median |
nginx.http.request.time.max |
nginx.upstream.response.time.pctl95 |
nginx.http.request.time.median |
nginx.upstream.status.1xx |
nginx.http.request.time.pctl95 |
nginx.upstream.status.2xx |
nginx.upstream.connect.time |
nginx.upstream.status.3xx |
nginx.upstream.connect.time.count |
nginx.upstream.status.4xx |
nginx.upstream.connect.time.max |
nginx.upstream.status.5xx |
nginx.upstream.connect.time.median |
nginx.upstream.status.discarded |
nginx.upstream.connect.time.pctl95 |
For a full description of the available NGINX and NGINX Plus metrics, see the NGINX Plus Amplify documentation.
Configuring a Filter
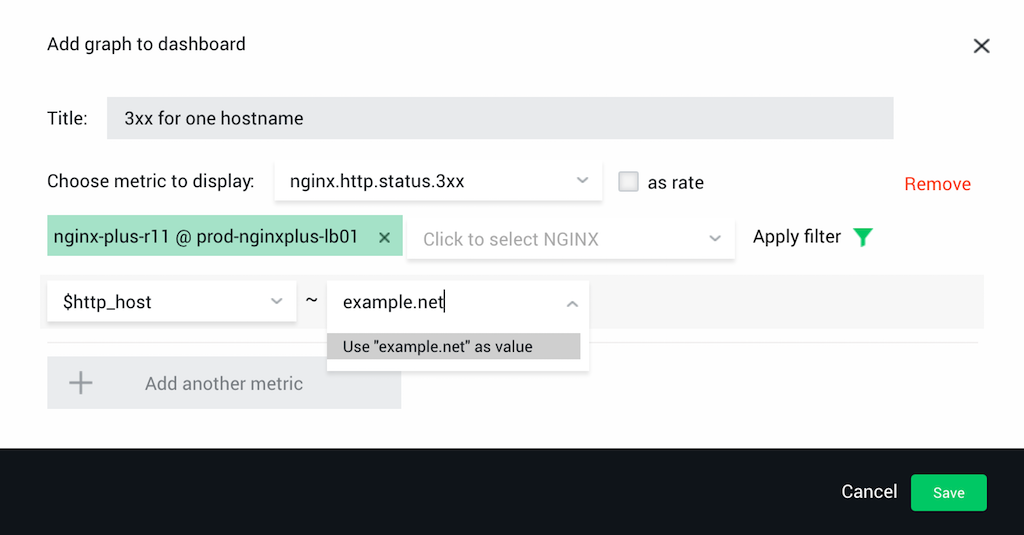
Here, we provide the high‑level steps for configuring a filter. Because filters are so powerful in NGINX Amplify, you will want to use these steps as a starting point for your own experimentation.
To configure a filter, follow these steps:
- Create a new graph or a new value in a custom dashboard.
- Give the graph or the value a name in the Title field.
- Select a metric that supports filters (see above) from the Choose metric to display drop‑down menu.
- Select one or more NGINX instances.
- Click Apply filter.
- Click the Click to select filter key drop‑down menu that appears and select or type a variable name, then click the Type or select filter value drop‑down menu that appears and type a static value or regular expression. (In the screen shot, we’ve specified $http_host as the key and example.net as the value.)
- Click Use “your‑expression” as a value.
- Add additional filters if needed.
- Click the Save button in the dialog box and then the Done button in the top right corner of the dashboard.
Configuration Examples for Custom Dashboards and Filters
Following are some examples of how to use NGINX Amplify custom dashboards and filters to address common concerns in NGINX web server deployments.
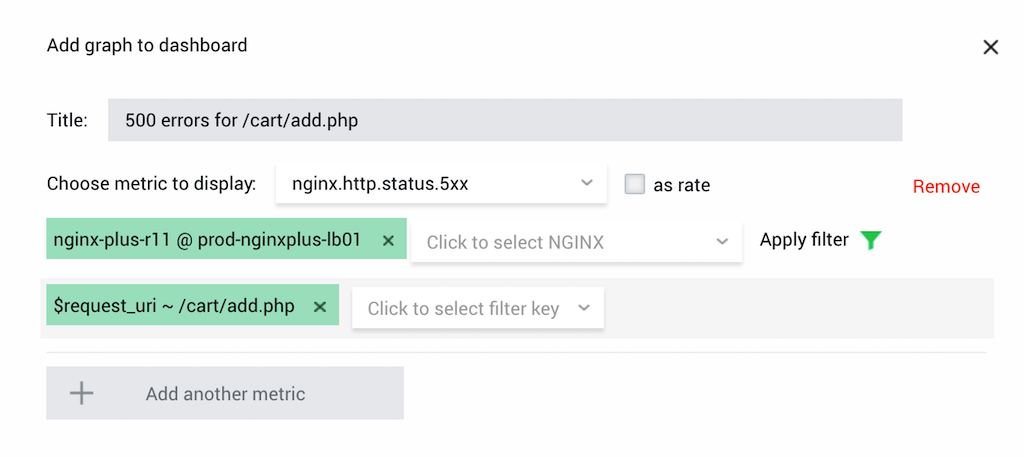
Monitor 500 Internal Server Errors for Critical URLs
Most large deployments have an acceptable rate of 500 errors (Internal Server Error). These errors happen for multiple reasons, and some of the errors are not critical to the operation of your website. However, business‑critical URLs need a special monitoring level. For ecommerce sites, this usually includes URLs for adding items to a shopping cart or specifying the payment method.
Solution: If your business‑critical URL is /cart/add.php, create a graph for metric nginx.upstream.status.5xx, and add the filter $request_uri ~ /cart/add.php.
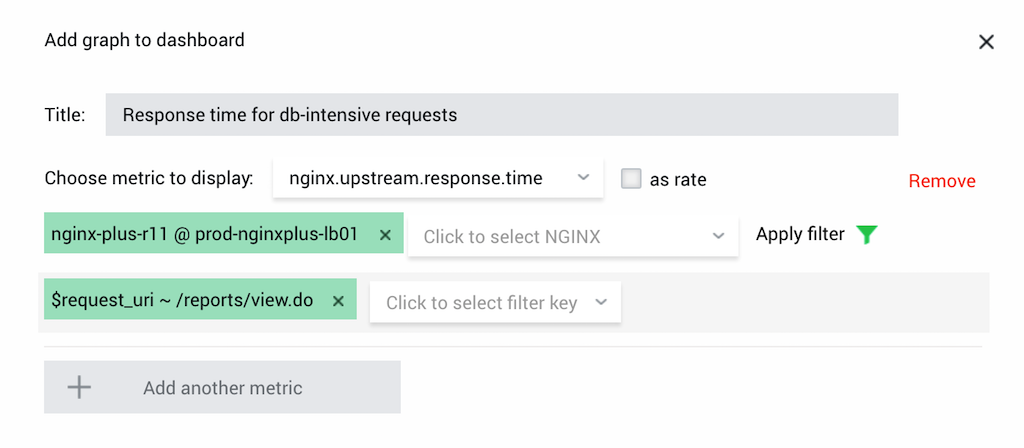
Monitor NGINX Response Time for Database‑Intensive Requests
Different requests impact databases differently. A simple average of response time does not always show the impact of specific requests on your database performance. Monitoring the $upstream_response_time metric with NGINX Amplify provides initial data for database optimization.
Solution: If your database‑intensive requests fetch the URL /reports/view.do, create a graph for metric nginx.upstream.response.time and a filter for your database‑intensive requests by URL: $request_uri ~ /reports/view.do.
You can also monitor just the 95th percentile of these requests with the metric nginx.upstream.response.time.pctl95.
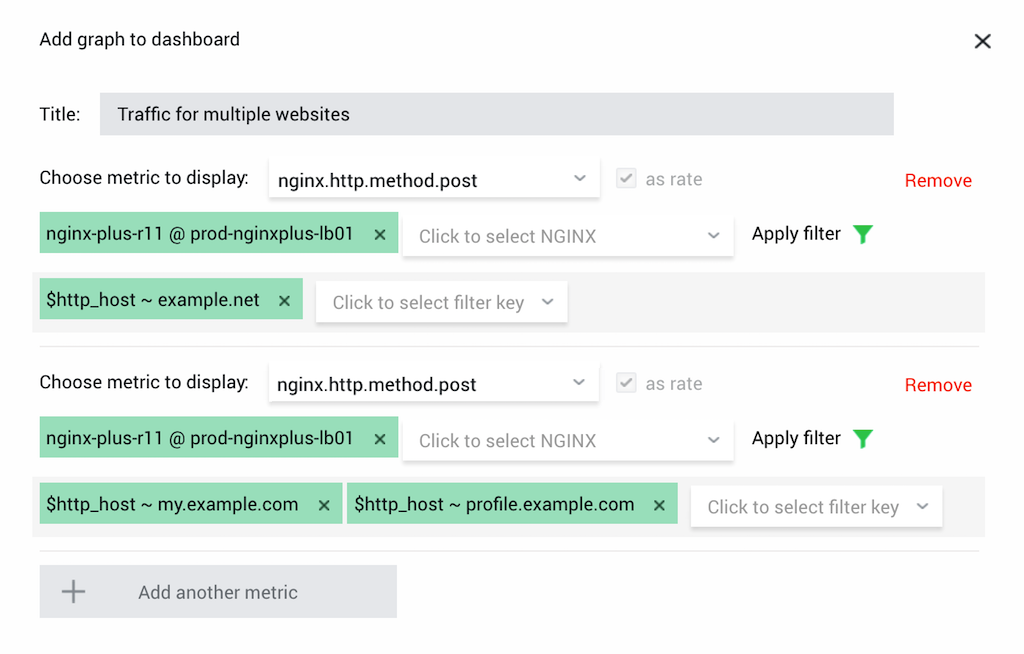
Monitor POST Requests for Multiple Virtual Servers
If you host multiple virtual servers (vhosts) and need to know how many POST requests come from their users, NGINX Amplify can help you.
Solution: Add the $http_host variable to your log_format. Then, create one or more graphs for the metric nginx.http.method.post, filtering on the $http_host variable.
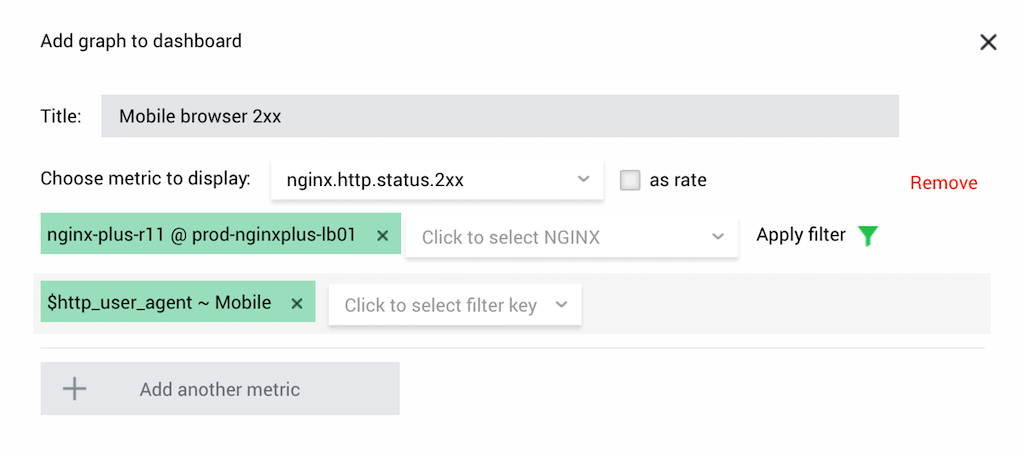
Monitor Mobile Browser Usage
Many websites use the same infrastructure for multiple clients. In most cases the clients identify themselves through the User-Agent HTTP header. You can create a filter on that header and monitor mobile browser usage.
Solution: Add a graph charting the metric nginx.http.status.2xx and create a filter $http_user_agent ~ Mobile.
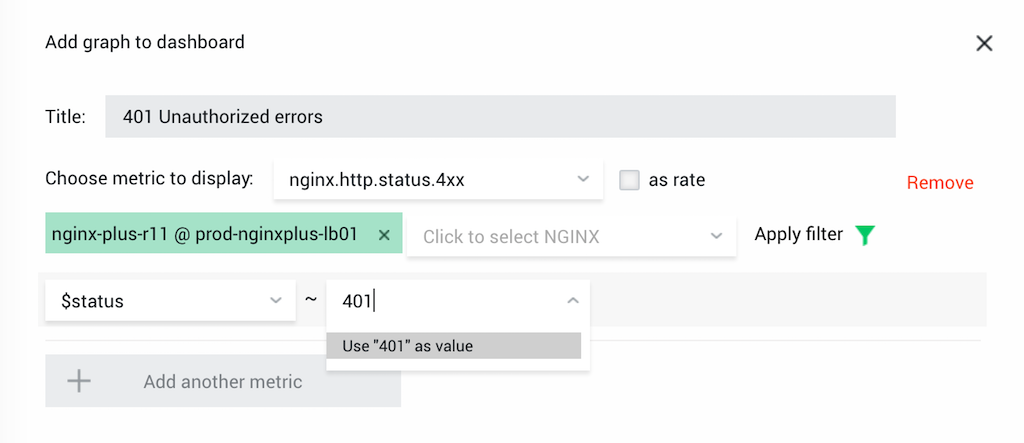
Monitor 401 Errors
Many monitoring systems provide aggregated metrics for the 2xx, 3xx, 4xx, and 5xx status and error code ranges. When you need to drill down to a specific error code, you can create a custom filter.
Solution: Create a graph on the metric nginx.http.status.4xx and the filter $status ~ 401. In addition, you can create a filter on a specific URI.
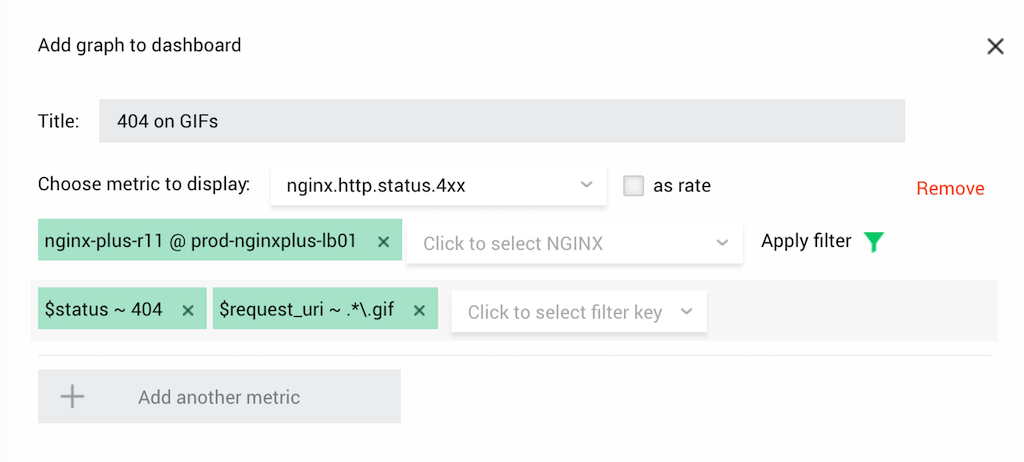
Use Regular Expressions to Monitor 404 Errors for GIF Files
With regular expressions, you can select specific file types or other patterns in the logged variables.
Solution: Create a graph with the metric nginx.http.status.4xx and a combination of filters, $status ~ 404 and $request_uri ~ .*.gif.
Summary
With NGINX Amplify, you can quickly and easily configure advanced monitoring for your NGINX deployment. Set up multiple custom dashboards with multiple graphs, then extend the monitoring configuration with a set of filters. Filter and dashboard configuration is done via the web interface, and additional configuration of the NGINX host is minimal.
Sign up for free and start using NGINX Amplify today.