Many of today’s applications are getting more distributed in nature. Engineers and architects are choosing to implement different approaches for making the apps more scalable and responsive to infrastructure changes. The popularity of “microservices” is rising, and we have written many overview posts on this topic.
- A very useful and popular series by Chris Richardson about microservices application design
- The Chris Richardson articles collected into a free ebook, with additional tips on implementing microservices with NGINX and NGINX Plus
- A series of blogs about the NGINX Microservices Reference Architecture (MRA), also available as a free ebook
- Other microservices blog posts
- Microservices webinars
Making your application more distributed does not always come easy, however. New challenges arise in areas that previously didn’t even exist. Let’s take a close look at some of the challenges in monitoring distributed applications.
Larger Number of Objects to Monitor
When you break your application out into multiple services, the plain number of monitored objects rises significantly. We regularly see examples where hundreds of different services are scaled from tens to thousands of instances each.
With NGINX Amplify as your monitoring system, you can use multiple interface features to select and aggregate the metrics from multiple service instances. To name a few:
- Image name – Specify the image name with the
imagenameparameter orAMPLIFY_IMAGE_NAMEenvironment variable in /etc/amplify-agent/agent.conf. NGINX Amplify aggregates the metrics from all instances with the image name into a single instance in the NGINX Amplify Web UI. - Hostname – Specify the hostname with the
hostnameparameter orAMPLIFY_HOSTNAMEenvironment variable in /etc/amplify-agent/agent.conf. Otherwise, NGINX Amplify uses the default hostname generated by your infrastructure, which might be nondescriptive or just plain unusable. - Aliases – Define user‑friendly names for your services in the Web UI.
- Tags – Since March 2017, NGINX Amplify has supported tagging of NGINX instances. After creating a tag, you can use it in the custom dashboards, and create graphs showing the aggregated or average value for all objects that have the tag.
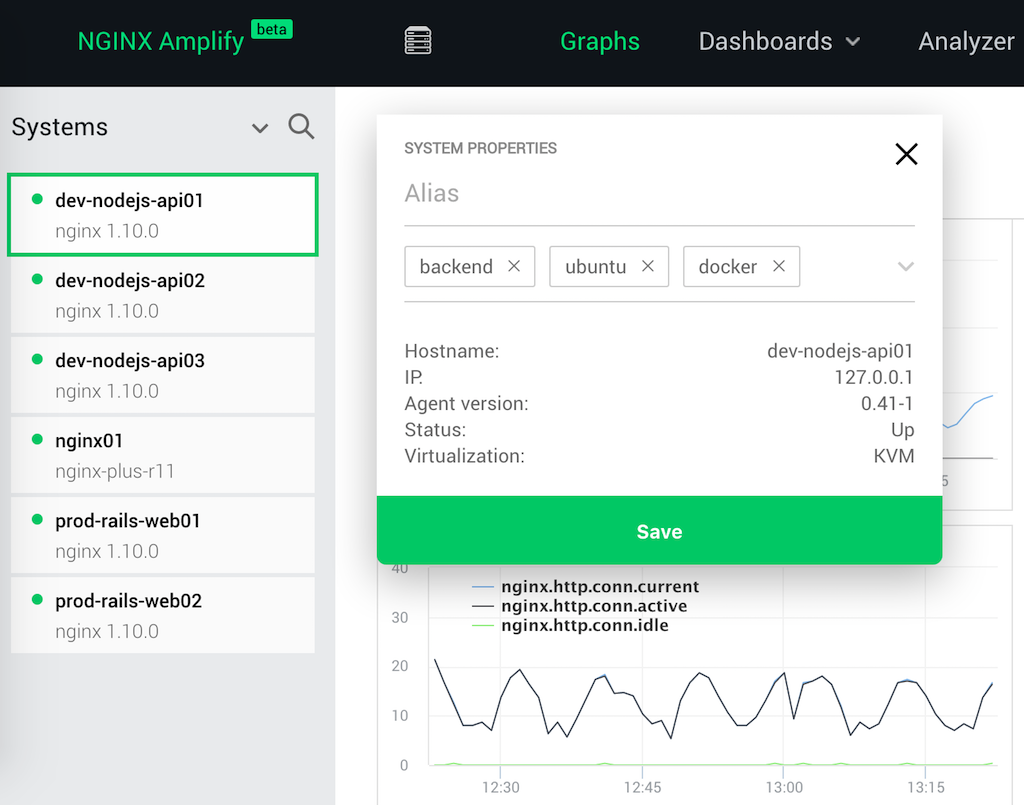
In the figure below we have tagged the dev-nodejs-api01 NGINX instance with backend, ubuntu, and docker.
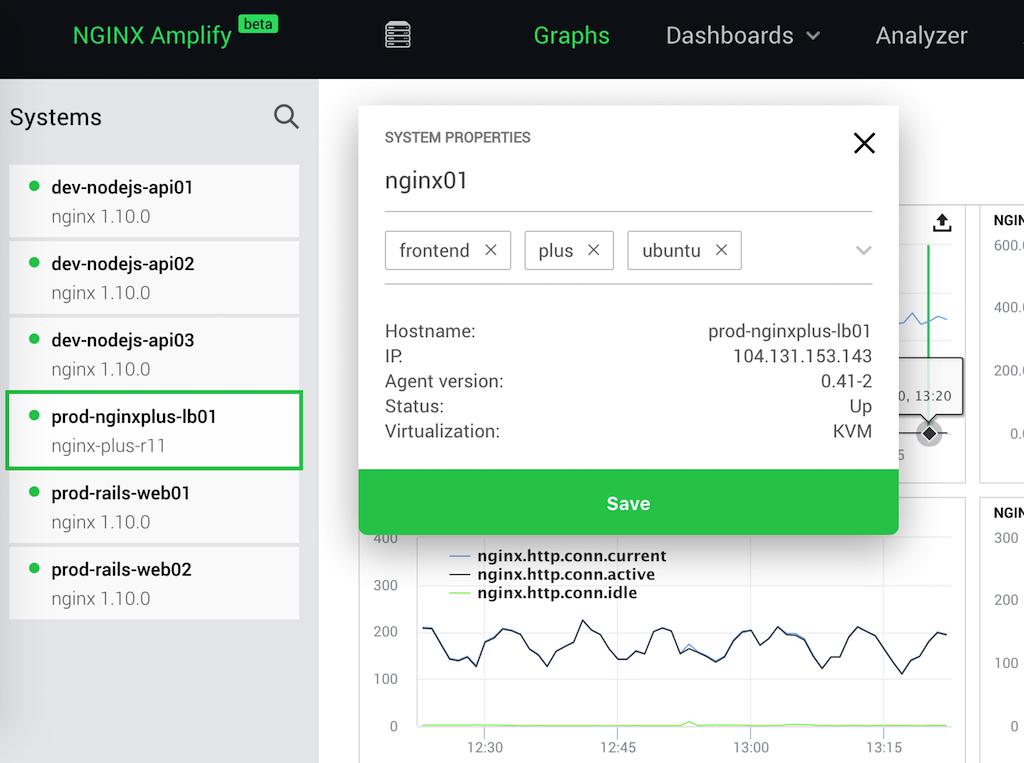
In the next figure we have tagged the prod-nginxplus-lb01 instance with frontend, plus, and ubuntu, and also created the alias nginx01 for it.
Complicated Network Communication
In a distributed application, most of the services are making HTTP calls to other services, and you need to monitor this network traffic appropriately.
Having NGINX as a part of your distributed application delivery system simplifies the networking layer, because it extends the same set of network features across multiple systems. This includes the use of SSL/TLS, keepalive connections, tracing of requests with the $request_id variable, rate limiting, advanced Layer 7 routing to your applications, etc. Using NGINX for multiple purposes (proxying, load balancing, caching, and so on) also means you can monitor just one solution rather than a number of tools that each perform one function.
Installation, configuration, and ongoing use of NGINX Amplify is simpler than other solutions. NGINX Amplify parses your NGINX configuration files, finds the location and formats of all the logs and stats interfaces, then instantly starts monitoring them. It also doubles as a simple system‑level monitor, and you can even use it to monitor network traffic for servers that don’t have NGINX installed.
Short Object Lifetime
The microservices approach promotes shorter lifetimes for objects, which fits well with immutable infrastructure. The lifetime of a service instance in a microservices application might be as low as a few minutes or hours, in contrast to monolithic applications where an instance might live for days or even months.
Some monitoring systems are not useful for objects with short lifetimes, because there is a long delay before data from an object starts appearing in the monitoring system. NGINX Amplify starts parsing logs and collecting metrics as soon as it finishes parsing its configuration file. It sends monitoring data to the cloud every minute.
Multiple Software Stacks
One advantage of distributed applications is that all components do not have to conform to the same software stack guidelines. Many organizations prefer to limit the number of application stacks for reasons of simplified deployment, but few use only one stack throughout a distributed application. Most choose several different application languages and services to best fit specific purposes.
Placing NGINX and NGINX Amplify in front of every application instance provides the same delivery layer across multiple software stacks. NGINX supports application server protocols like FastCGI or uwsgi together with the HTTP protocol. You can use it in front of your application servers regardless of the application language (Go, Node.js, PHP, Python, etc.).
Instance Termination
In many environments the average service instance does not have a permanent filesystem, and it’s terminated after short‑term use. Collecting of the log is usually implemented in a distributed syslog‑compliant server or service.
NGINX Amplify Agent can be a local syslog server for metric aggregation. This way, your NGINX instance sends logs locally to the agent, and the agent does not try to access /var/log/nginx/access.log in the local filesystem. This does not mean that you can disable existing log collectors or syslog servers. NGINX Amplify components cannot store log data; they only store aggregated metrics derived from the logs. Configuration of the syslog feature is simple; refer to the NGINX Amplify documentation for details.
Summary
NGINX Amplify incorporates many features that make it ideal for distributed application monitoring. Its configuration options for aggregation of statistics, user-friendly naming, and tagging make it easier to monitor multiple service instances. Its quick startup and support of syslog-based logging make it suitable for the short-lived service instances common to microservices applications. And together with NGINX and NGINX Plus, it makes it easier to track complicated network communication and to support a mix of software stacks.
Sign up today to start using NGINX Amplify for free. You can also start a free 30‑day trial of NGINX Plus today or contact us to learn more about how NGINX Plus and NGINX Amplify can improve the performance of your distributed applications.