Many performance benchmarks measure peak throughput or requests per second (RPS), but those metrics can oversimplify the performance story at real‑world sites. Few organizations run their services at or near peak throughput, where a 10% change in performance either way can make a significant difference. The throughput or RPS a site requires is not infinite, but is fixed by external factors like the number of concurrent users they have to serve and the activity level of each user. In the end, what matters most is that your users receive the best level of service. End users don’t care how many other people are visiting your site. They just care about the service they receive and don’t excuse poor performance because the system is overloaded.
This leads us to the observation that what matters most is that an organization deliver consistent, low‑latency performance to all their users, even under high load. In comparing NGINX and HAProxy running on Amazon Elastic Compute Cloud (EC2) as reverse proxies, we set out to do two things:
- Determine what level of load each proxy comfortably handles
- Collect the latency percentile distribution, which we find is the metric most directly correlated with user experience
Testing Protocols and Metrics Collected
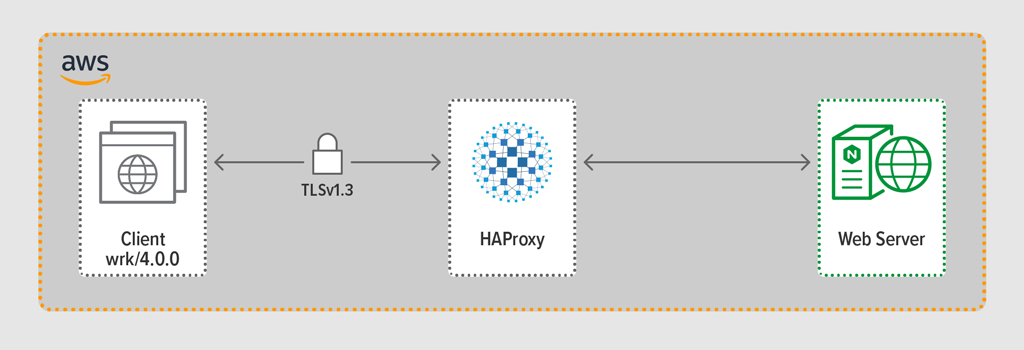
We used the load‑generation program wrk2 to emulate a client, making continuous requests over HTTPS during a defined period. The system under test – HAProxy or NGINX – acted as a reverse proxy, establishing encrypted connections with the clients simulated by wrk threads, forwarding requests to a backend web server running NGINX Plus R22, and returning the response generated by the web server (a file) to the client.
Each of the three components (client, reverse proxy, and web server) ran Ubuntu 20.04.1 LTS on a c5n.2xlarge Amazon Machine Image (AMI) in EC2.
As mentioned, we collected the full latency percentile distribution from each test run. Latency is defined as the amount of time between the client generating the request and receiving the response. A latency percentile distribution sorts the latency measurements collected during the testing period from highest (most latency) to lowest.
Testing Methodology
Client
Using wrk2 (version 4.0.0), we ran the following script on the Amazon EC2 instance:
taskset -c 0-3 wrk -t 4 -c 100 -d 30s -R requests_per_second --latency https://adc.domain.com:443/To simulate many clients accessing a web application, 4 wrk threads were spawned that together established 100 connections to the reverse proxy. During the 30-second test run, the script generated a specified number of RPS. These parameters correspond to the following wrk2 options:
‑toption – Number of threads to create (4)‑coption – Number of TCP connections to create (100)‑doption – Number of seconds in the testing period (30 seconds)‑Roption – Number of RPS issued by the client‑‑latencyoption – Output includes corrected latency percentile information
We incrementally increased the number of RPS over the set of test runs until one of the proxies hit 100% CPU utilization. For further discussion, see Performance Results.
All connections between client and proxy were made over HTTPS with TLSv1.3. We used ECC with a 256‑bit key size, Perfect Forward Secrecy, and the TLS_AES_256_GCM_SHA384 cipher suite. (Because TLSv1.2 is still commonly used on the Internet, we re‑ran the tests with it as well; the results were so similar to those for TLSv1.3 that we don’t include them here.)
HAProxy: Configuration and Versioning
We provisioned HAProxy version 2.3 (stable) as the reverse proxy.
The number of simultaneous users at a popular website can be huge. To handle the large volume of traffic, your reverse proxy needs to be able to scale to take advantage of multiple cores. There are two basic ways to scale: multi‑processing and multi‑threading. Both NGINX and HAProxy support multi‑processing, but there is an important difference – in HAProxy’s implementation, processes do not share memory (whereas in NGINX they do). The inability to share state across processes has several consequences for HAProxy:
- Configuration parameters – including limits, statistics, and rates – must be defined separately for each process.
- Performance metrics are collected per‑process; combining them requires additional config, which can be quite complex.
- Each process handles health checks separately, so target servers are probed per process rather than per server as expected.
- Session persistence is not possible.
- A dynamic configuration change made via the HAProxy Runtime API applies to a single process, so you must repeat the API call for each process.
Because of these issues, HAProxy strongly discourages use of its multi‑processing implementation. To quote directly from the HAProxy configuration manual:
USING MULTIPLE PROCESSES IS HARDER TO DEBUG AND IS REALLY DISCOURAGED.
HAProxy introduced multi‑threading in version 1.8 as an alternative to multi‑processing. Multi‑threading mostly solves the state‑sharing problem, but as we discuss in Performance Results, in multi‑thread mode HAProxy does not perform as well as in multi‑process mode.
Our HAProxy configuration included provisioning for both multi‑thread mode (HAProxy MT) and multi‑process mode (HAProxy MP). To alternate between modes at each RPS level during the testing, we commented and uncommented the appropriate set of lines and restarted HAProxy for the configuration to take effect:
$ sudo service haproxy restartHere’s the configuration with HAProxy MT provisioned: four threads are created under one process and each thread pinned to a CPU. For HAProxy MP (commented out here), there are four processes each pinned to a CPU.
global
    #Multi-thread mode
    nbproc 1
    nbthread 4
    cpu-map auto:1/1-4 0-3

    #Multi-process mode
    #nbproc 4
    #cpu-map 1 0
    #cpu-map 2 1
    #cpu-map 3 2
    #cpu-map 4 3

    ssl-server-verify none
    log /dev/log    local0
    log /dev/log    local1 notice
    chroot /var/lib/haproxy
    maxconn 4096

defaults
    log    global
    option httplog
    option http-keep-alive

frontend Local_Server
    bind 172.31.12.25:80
    bind 172.31.12.25:443 ssl crt /etc/ssl/certs/bundle-hapee.pem
    redirect scheme https code 301 if !{ ssl_fc }
    default_backend Web-Pool
    http-request set-header Connection keep-alive

backend Web-Pool
    mode http
    server server1 backend.workload.1:80 check
NGINX: Configuration and Versioning
We deployed NGINX Open Source version 1.18.0 as the reverse proxy.
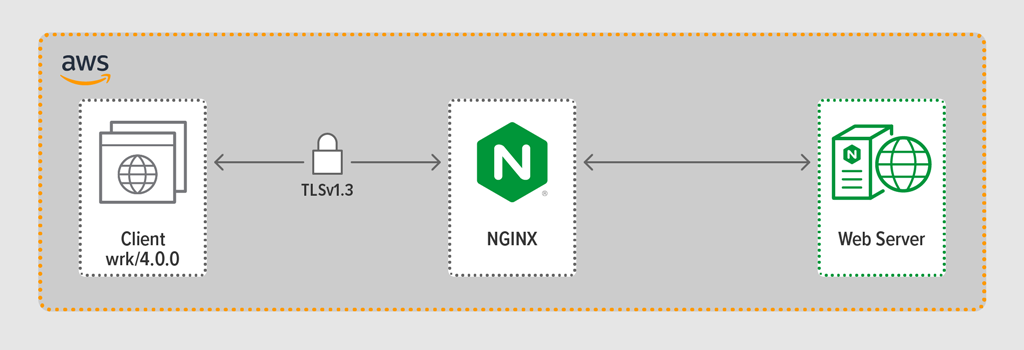
To use all the cores available on the machine (four in this case), we included the auto parameter to the worker_processes directive, which is also the setting in the default nginx.conf file distributed from our repository. Additionally, the worker_cpu_affinity directive was included to pin each worker process to a CPU (each 1 in the second parameter denotes a CPU in the machine).
user                nginx;
worker_processes    auto;
worker_cpu_affinity auto 1111;

error_log /var/log/nginx/error.log warn;
pid       /var/run/nginx.pid;


events {
    worker_connections 1024;
}

http {
    include      /etc/nginx/mime.types;
    default_type application/octet-stream;

    log_format main '$remote_addr - $remote_user [$time_local] "$request" '
                    '$status $body_bytes_sent "$http_referer" '
                    '"$http_user_agent" "$http_x_forwarded_for"';

    access_log /var/log/nginx/access.log  main;

    sendfile           on;
    keepalive_timeout  65;
    keepalive_requests 100000;

    server {
        listen              443 ssl reuseport;
        ssl_certificate     /etc/ssl/certs/hapee.pem;
        ssl_certificate_key /etc/ssl/private/hapee.key;
        ssl_protocols       TLSv1.3;

        location / {
            proxy_set_header   Connection ' ';
            proxy_http_version 1.1;
            proxy_pass         http://backend;
        }
    }

    upstream backend {
        server    backend.workload.1:80;
        keepalive 100;
    }
}
Performance Results
With your reverse proxy acting as the front end to your application, its performance is critical.
We tested each reverse proxy (NGINX, HAProxy MP, and HAProxy MT) at increasing numbers of RPS until one of them reached 100% CPU utilization. All three performed similarly at the RPS levels where CPU was not exhausted.
Reaching 100% CPU utilization occurred first for HAProxy MT, at 85,000 RPS, and at that point performance worsened dramatically for both HAProxy MT and HAProxy MP. Here we present the latency percentile distribution of each reverse proxy at that load level. The chart was plotted from the output of the wrk script using the HdrHistogram program available on GitHub.
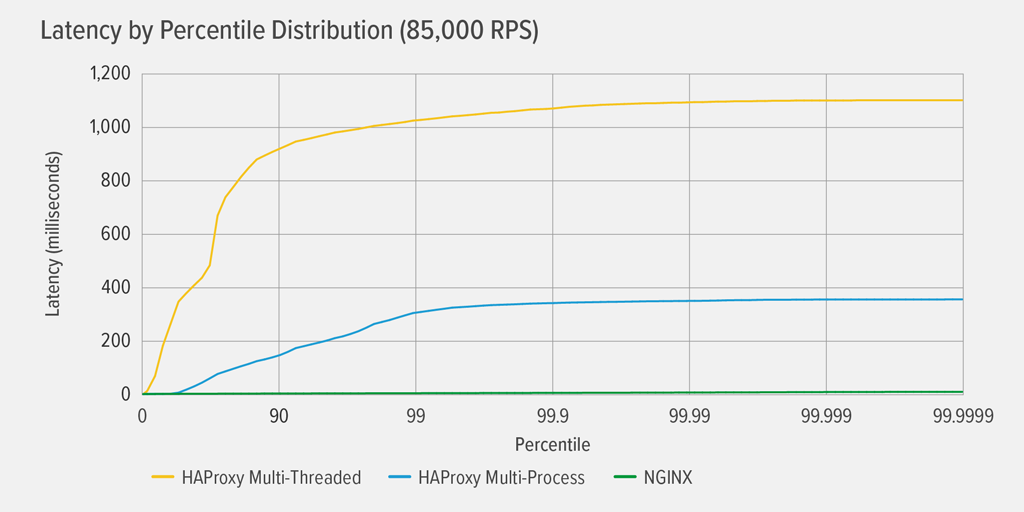
At 85,000 RPS, latency with HAProxy MT climbs abruptly until the 90th percentile, then gradually levels off at approximately 1100 milliseconds (ms).
HAProxy MP performs better than HAProxy MT – latency climbs at a slower rate until the 99th percentile, at which point it starts to level off at roughly 400ms. (As a confirmation that HAProxy MP is more efficient, we observed that HAProxy MT used slightly more CPU than HAProxy MP at every RPS level.)
NGINX suffers virtually no latency at any percentile. The highest latency that any significant number of users might experience (at the 99.9999th percentile) is roughly 8ms.
What do these results tell us about user experience? As mentioned in the introduction, the metric that really matters is response time from the end‑user perspective, and not the service time of the system under test.
It’s a common misconception that the median latency in a distribution best represents user experience. In fact, the median is the number that about half of response times are worse than! Users typically issue many requests and access many resources per page load, so several of their requests are bound to experience latencies at the upper percentiles in the chart (99th through 99.9999th). Because users are so intolerant of poor performance, latencies at the high percentiles are the ones they’re most likely to notice.
Think of it this way: your experience of checking out at a grocery store is determined by how long it takes to leave the store from the moment you got in the checkout line, not just how long it took for the cashier to ring up your items. If, for example, a customer in front of you disputes the price of an item and the cashier has to get someone to verify it, your overall checkout time is much longer than usual.
To take this into account in our latency results, we need to correct for something called coordinated omission, in which (as explained in a note at the end of the wrk2 README) “high latency responses result in the load generator coordinating with the server to avoid measurement during high latency periods”. Luckily wrk2 corrects for coordinated omission by default (for more details about coordinated omission, see the README).
When HAProxy MT exhausts the CPU at 85,000 RPS, many requests experience high latency. They are rightfully included in the data because we are correcting for coordinated omission. It just takes one or two high‑latency requests to delay a page load and result in the perception of poor performance. Given that a real system is serving multiple users at a time, even if only 1% of requests have high latency (the value at the 99th percentile), a large proportion of users are potentially affected.
Conclusion
One of the main points of performance benchmarking is determining whether your app is responsive enough to satisfy users and keep them coming back.
Both NGINX and HAProxy are software‑based and have event‑driven architectures. While HAProxy MP delivers better performance than HAProxy MT, the lack of state sharing among the processes makes management more complex, as we detailed in HAProxy: Configuration and Versioning. HAProxy MT addresses these limitations, but at the expense of lower performance as demonstrated in the results.
With NGINX, there are no tradeoffs – because processes share state, there’s no need for a multi‑threading mode. You get the superior performance of multi‑processing without the limitations that make HAProxy discourage its use.
To get started with NGINX Open Source, download binaries or source.
To try NGINX Plus, start your free 30-day trial today or contact us to discuss your use cases.