
The API management (APIM) market is a crowded space. The latest Gartner Magic Quadrant for Full Life Cycle API Management ranks 22 vendors, with 7 in the Leaders quadrant. Competing in an existing market requires establishing a strong position to differentiate and stand out from the competition. So what makes NGINX’s API management solution different?
At NGINX our goal is to make lightweight, high‑performance software. NGINX Open Source has become the go‑to web server for the world’s busiest sites because its event‑driven architecture scales better than web servers that spawn a process or thread for each connection. NGINX Open Source is also the industry’s most ubiquitous API gateway, an infrastructure component that processes API traffic in APIM solutions like those from Apigee, Axway, IBM DataPower, Kong, Red Hat 3scale, and Torry Harris.
The NGINX Controller API Management Module is a high‑performance APIM solution. In this blog we’ll compare its performance to Kong, a competitor known for its high performance. Kong is built on NGINX, and uses Lua to implement its API functionality, whereas the API Management Module relies completely on native, high‑performance capabilities that are implemented as NGINX Plus modules. NGINX’s API management solution is built on an innovative architecture that decouples the data plane and control plane. All API calls are handled directly by NGINX Plus acting as the API gateway (data plane) without requiring any interaction with the control plane. This results in high‑performance API traffic mediation for both north‑south and east‑west traffic.
A sneak peak at the results: the NGINX Controller API Management Module outperforms Kong by 2x.
A special thank you to Intel for providing the hardware and lab space used to do this testing. Full test and hardware details can be found in the Appendix.
Latency Added to a Single Request
In this test we compared the additional latency introduced by the API manager to a single request, for files of 0 KB and 1 KB in size. We used curl to send the single HTTP request (details).
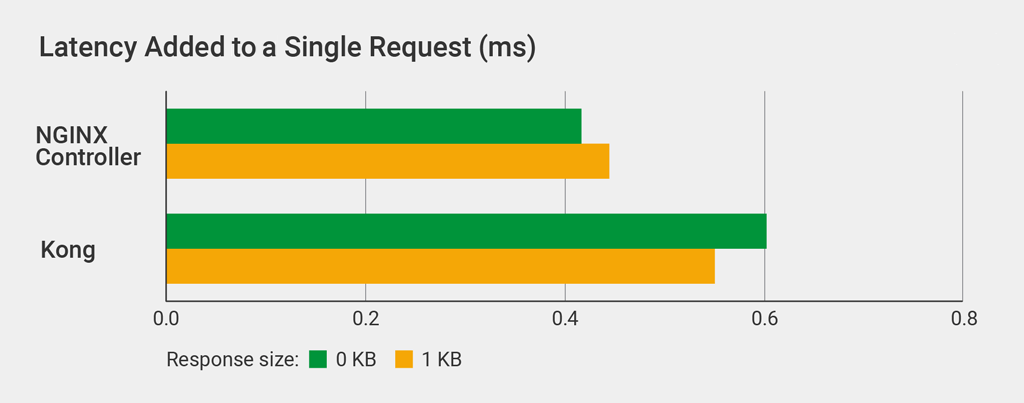
Kong increases latency compared to the API Management Module: by 44% for a 0-KB file and 24% for a 1-KB file.
API Calls Per Second
A standard HTTP scalability metric is requests per second (RPS). The equivalent metric in the context of APIM is API calls per second. We used wrk to send a continuous stream of requests for either a 0-KB or 1-KB file, on 300 connections for 3 minutes (details).
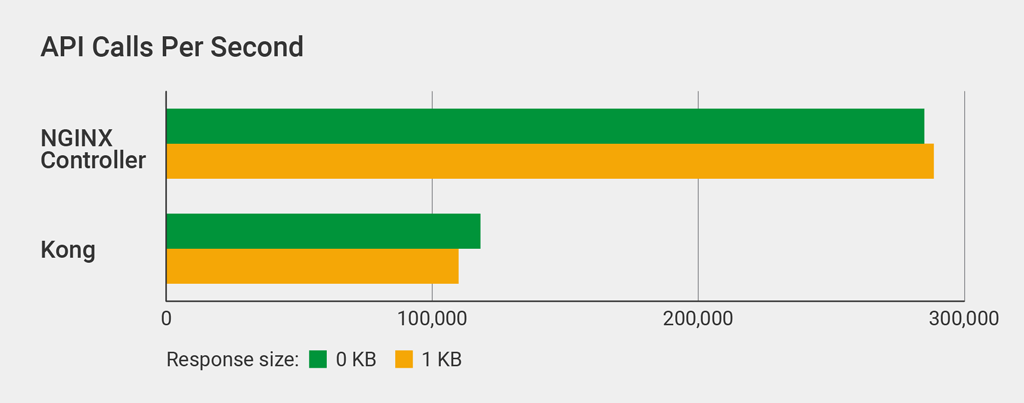
The API Management Module outperformed Kong – handling 2.6x as many API calls per second for 1-KB responses.
CPU Usage
The API Management Module introduces less latency and handles more API calls per second than Kong because it uses the CPU more efficiently. We measured CPU usage at increasing numbers of API calls per second. We used a single core, so the absolute number of API calls per second is much lower than in the previous test, where we used 22 cores (details).
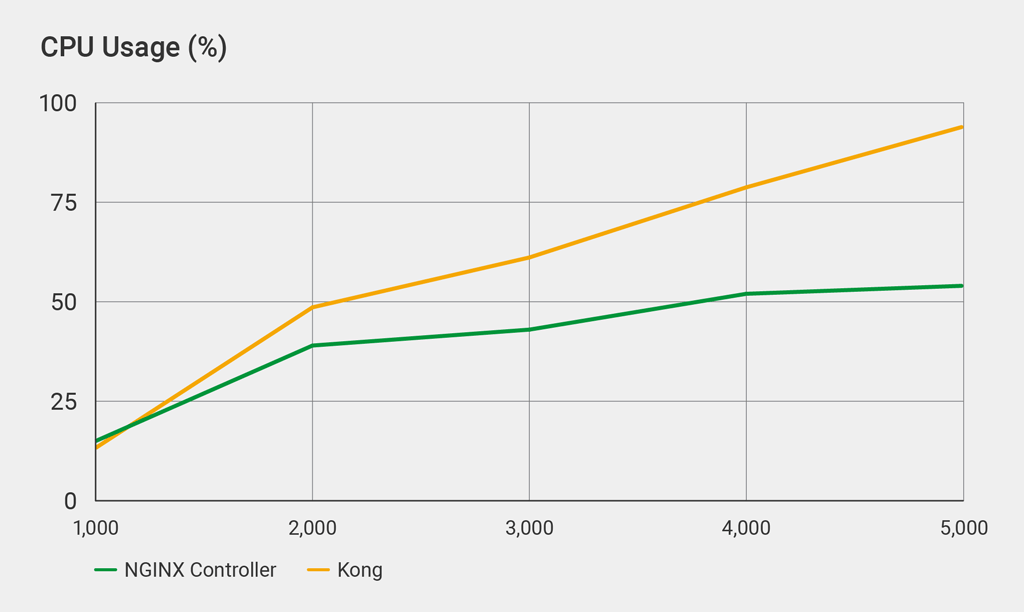
Kong effectively caps out at 5,000 API calls per second – latency spikes noticeably at call volumes any higher than that, indicating the system is fully loaded. At 5,000 calls per second, CPU usage is 93%, 73% higher than the API Management Module.
API Calls Per Second with JWTs
The final test measures how well each API gateway validates JSON Web Tokens (JWTs), the preferred method for authenticating API requests. Your most important API endpoints will likely be authenticated, so this test more closely approximates a real‑world configuration.
We used the same JWT, signed using HS256, with both gateways (details).
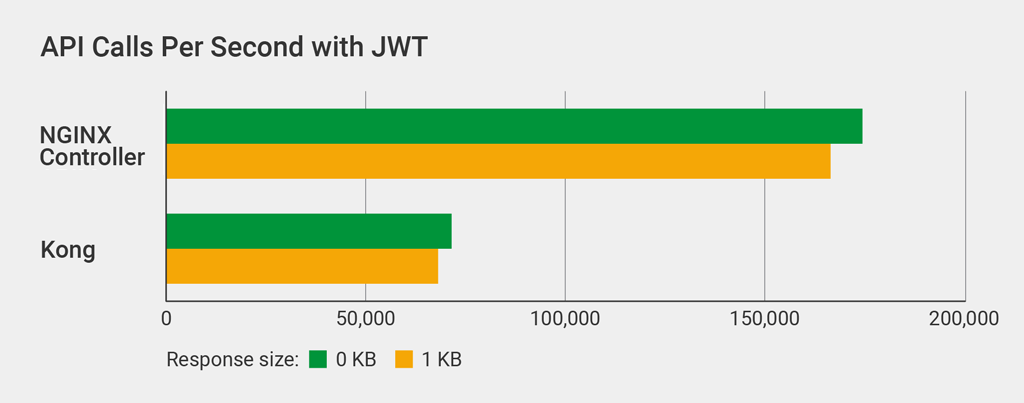
The API Management Module handles more than 2x as many JWT‑authenticated API calls per second as Kong.
How NGINX Controller Works
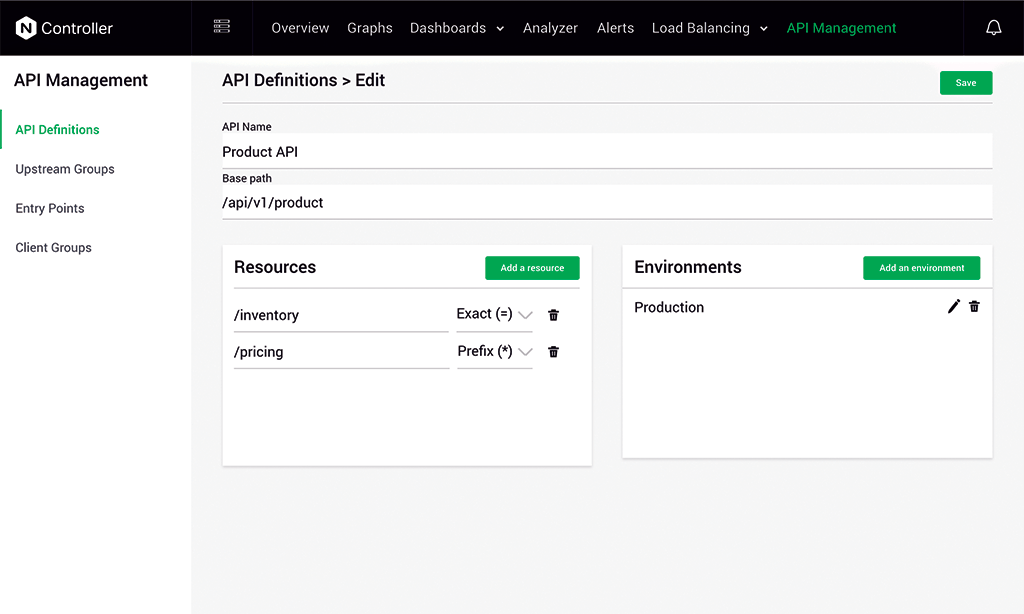
NGINX Controller is a control‑plane solution that manages the NGINX Plus data plane. NGINX Controller enables you to manage the entire lifecycle of NGINX Plus, as a load balancer, API gateway, or a proxy in a service mesh environment. With NGINX Controller’s API Management Module, you can define, publish, secure, monitor, and analyze APIs.
Under the hood, NGINX Controller generates NGINX Plus configuration which is published to the underlying NGINX Plus data plane. The core configuration loader has a very efficient mechanism for storing configurations in memory, enabling the API Management Module to deliver high performance for APIs.
Conclusion
Many companies already use NGINX Open Source as their API gateway. Capital One has been able to scale to over 12 billion API calls per day using NGINX Open Source. In fact, many of our competitors, including Kong, use NGINX Open Source under the hood in their APIM solutions. Our lightweight design – based on native, high‑performance NGINX configuration along with NGINX Plus modules – enables the API Management Module to scale better than NGINX‑derivative competition.
Latency is one of the most important metrics for end‑user experience. High latency reduces app responsiveness, frustrating users. The API Management Module adds 20–30% less latency to user requests compared to Kong. It also uses system resources more efficiently, using 40% less CPU than Kong for the same workload.
Appendix
Topology
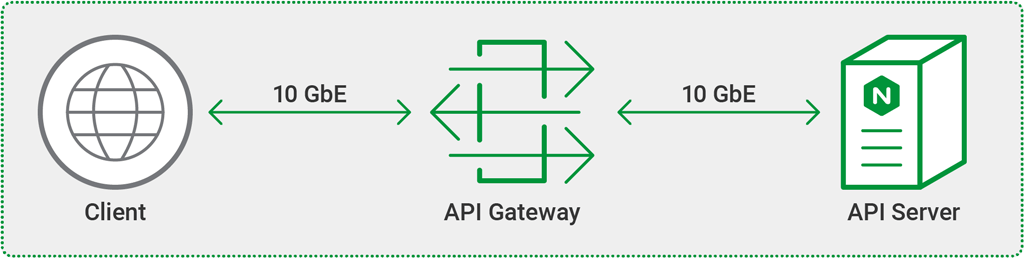
All tests were done using three separate machines connected by 10 GbE links in a simple, flat Layer 2 network.
Hardware Used
The following hardware was used for the testing. All three machines were identical. Hyperthreading was not used. In previous testing we did not observe a major difference in performance from hyperthreading.
| CPU | Network | Memory |
|---|---|---|
| Intel® Xeon(R) CPU E5‑2699 v4 @ 2.20GHz, 22 cores | Intel Ethernet Controller 10‑Gigabit X540‑AT2 | 128 GB |
Software Used
The following software was used to do the testing:
- NGINX Controller API Management Module version 2.
- Kong Open Source version 1.0.0. We did not test Kong Enterprise, but none of its additional features are relevant to our tests (for example, Kong Open Source and Kong Enterprise use the same JWT plug‑in).
curlversion 7.61.0.- Docker version 18.09.1. To make management easier, we ran both Kong and the API Management Module inside Docker containers. We found that Docker reduces performance by about 30%, but because we’re comparing relative performance, the benefits of using Docker outweighed the performance hit.
mpstatin version 12.0.1 of thesystatpackage.wrkversion 4.1.0, installed according to these instructions.
NGINX Configuration
The following NGINX configuration was used for the testing.
upstream my_upstream {
    keepalive 60;
    server API-server:80;
    keepalive_requests 3000000;
    keepalive_timeout 300;
}

server {
    listen 8000;

    access_log off;
    keepalive_requests 3000000;
    keepalive_timeout 300;

    tcp_nodelay on;

    location /test {
        set $apimgmt_environment 4;
        set $apimgmt_definition 3;
        set $upstream my_upstream;
        set $upstream_protocol http;
        rewrite ^ /_devel_4 last;
    }
    location = /_devel_4 {
        internal;
        set $apimgmt_definition_name my_api;
        set $apimgmt_environment_name devel;
        proxy_intercept_errors on;
        proxy_http_version 1.1;
        proxy_set_header Connection "";
        proxy_pass $upstream_protocol://$upstream/0kb;      # 0-KB file
        #proxy_pass $upstream_protocol://$upstream/1kb.bin; # 1-KB file
    }
}
We made the following settings to maximize performance. As detailed in the next section, we made similar settings in the Kong configuration.
keepalive_requestsandkeepalive_timeoutwere set to a high number to minimize overhead from setting up TCP connections.tcp_nodelaywas enabled, improving performance slightly by disabling Nagle’s algorithm.access_logwas disabled. Enabling it reduces performance by about 10%.- We used the two
proxy_passdirectives to request the appropriate file size.
Kong Configuration
We added the following configuration directives to kong.conf.default, matching the settings in the NGINX configuration discussed in the previous section.
nginx_http_tcp_nodelay=on
nginx_http_keepalive_requests=3000000
nginx_http_keepalive_timeout=300
proxy_access_log=off
We ran the following Kong API calls to create a route to the API server. The first command creates a service named test and the second creates the route /test pointing to the server.
$ curl -X POST http://localhost:8001/services/ \
  --data 'name=test' \
  --data 'url=http://API-server:80/0kb'

$ curl -X POST http://localhost:8001/services/test/routes \
  --data 'paths[]=/test'
The following commands display the configuration of the service and the route, respectively. We pipe the output to the jq tool to make it easier to read the JSON output.
$ curl localhost:8001/services/ | jq '.'
{
  "next": null,
  "data": [
    {
      "host": "172.20.40.32",
      "created_at": 1556770191,
      "connect_timeout": 60000,
      "id": "f4629d56-550b-4b37-aa59-66d931aa6f37",
      "protocol": "http",
      "name": "test",
      "read_timeout": 60000,
      "port": 80,
      "path": "/0kb",
      "updated_at": 1556770191,
      "retries": 5,
      "write_timeout": 60000
    }
  ]
}

$ curl localhost:8001/services/test/routes | jq '.'
{
  "next": null,
  "data": [
    {
      "created_at": 1556770191,
      "methods": null,
      "id": "a7b417af-ccd4-48f7-b787-ae19490194dc",
      "service": {
        "id": "f4629d56-550b-4b37-aa59-66d931aa6f37"
      },
      "name": null,
      "hosts": null,
      "updated_at": 1556770191,
      "preserve_host": false,
      "regex_priority": 0,
      "paths": [
        "/test"
      ],
      "sources": null,
      "destinations": null,
      "snis": null,
      "protocols": [
        "http",
        "https"
      ],
      "strip_path": true
    }
  ]
}
Testing Methodology
Latency Added to a Single Request
We used curl for the single‑request latency testing. To set a baseline, we first made a request to the API server without an API gateway in front of it. We then made the same request with each API gateway in front of the API server to measure the latency they introduced.
$ curl -w "@curl-latency.txt" -o /dev/null -s http://target-serverThe contents of curl-latency.txt:
    time_namelookup:  %{time_namelookup}\n
       time_connect:  %{time_connect}\n
    time_appconnect:  %{time_appconnect}\n
   time_pretransfer:  %{time_pretransfer}\n
      time_redirect:  %{time_redirect}\n
 time_starttransfer:  %{time_starttransfer}\n
                    ----------\n
         time_total:  %{time_total}\n
The chart in Latency Added to a Single Request shows time_total, in milliseconds. Here’s a sample output:
$ curl -w "@curl-latency.txt" -o /dev/null -s http://192.0.2.1/api-endpoint
    time_namelookup:  0.000035
       time_connect:  0.000364
    time_appconnect:  0.000000
   time_pretransfer:  0.000401
      time_redirect:  0.000000
 time_starttransfer:  0.001701
                    ----------
         time_total:  0.001727
API Calls Per Second
We tested API calls per second with wrk, a scalable benchmarking tool we use often. We tried various combinations of parameters, and this one maximized performance for both the API Management Module and Kong:
$ wrk -t 22 -c 300 -d 180 http://target-serverThe command creates 22 wrk threads (1 per core) and a total of 300 connections across the threads. The -d parameter specifies the duration of the test, in our case 180 seconds (3 minutes). Sample output:
$ wrk -t 22 -c 300 -d 180 http://192.0.2.1/api-endpoint
Running 3m test @ http://192.0.2.1/api-endpoint
  22 threads and 300 connections
  Thread Stats   Avg      Stdev     Max   +/- Stdev
    Latency    13.96ms    7.84ms 279.85ms   77.37%
    Req/Sec     0.96k   298.23     1.88k    68.55%
  3769861 requests in 3.00m, 36.25GB read
Requests/sec:  20934.34
Transfer/sec:    206.16MB
CPU Usage
We tested CPU usage with mpstat (a standard Linux tool for that purpose) while running the wrk command for API calls per second. Sample output (spread across two lines for legibility):
$ mpstat
Linux 4.18.0-13-generic (nbdw38) 	04/29/2019 	_x86_64_	(88 CPU)

03:34:50 PM  CPU    %usr   %nice    %sys %iowait    %irq   %soft  %steal  ...
03:34:50 PM  all    0.04    0.00    0.02    0.00    0.00    0.03    0.00  ...

      ... %guest  %gnice   %idle
      ...   0.00    0.00   99.91
API Calls Per Second with JWTs
We tested JWT performance with the wrk command for API calls per second, with the addition of the -H parameter to insert the JWT in the Authorization: Bearer HTTP header. We generated the JWT and JSON Web Keys (JWKs) using the instructions in this blog post, storing the JWT in a file named test.jwt.
$ wrk -t 22 -c 300 -d 180 -H "Authorization: Bearer `cat test.jwt`" \
  http://target-server