NGINX.COM
Web Server Load Balancing with NGINX Plus

NGINX One: A SaaS Solution for Modern Application Management and Delivery

NGINX One will soon be available “as-a-service,” with a single license and a unified management console for enterprise-wide security, availability, observability, and scalability—with a friendly pay-as-you-go pricing model.

Today at AppWorld, we are introducing and opening “early access” for NGINX One: a global SaaS offering for deploying, securing, monitoring, scaling, and managing all NGINX instances (whether they are on-prem, in the cloud, or at the edge), and all from a single management interface. It includes support for all our data plane components—NGINX Plus, NGINX Open Source, NGINX Unit, NGINX Gateway Fabric, and Kubernetes Ingress Controller—under a single enterprise license.

Breaking down silos, making NGINX easier for all

Unlike previous NGINX pricing models, NGINX One is completely consumption-based—you only pay for what you use. For every organization from startups to global enterprises, NGINX One makes deploying any NGINX use case simpler, faster, more secure, more scalable, easier to observe and monitor, and more cost effective.

Moreover, we are unifying our management plane into a more cohesive package on the F5 Distributed Cloud Platform, as enterprises have come to expect. This benefits not only traditional NGINX users in application development and DevOps roles, but also the broader community of F5 customers with other responsibilities, most of whom have NGINX deployed somewhere in their organizations. CIOs, CISOs, and their teams—network operations, security operations, and infrastructure—frequently share overlapping responsibilities for enterprise application delivery and security.

On the Distributed Cloud Platform, NGINX One users will benefit from many adjacent security and network capabilities that hybrid, multicloud enterprises are demanding. They can easily network across clouds with our multicloud network fabric without enduring complex integrations. They can configure granular security policies for specific teams and applications at a global level with less toil and fewer tickets. F5’s security portfolio shares a single WAF engine, commonly referred to as “OneWAF,” which allows organizations to migrate the same policies they were using in BIG-IP Advanced WAF to NGINX App Protect. And the Distributed Cloud Platform’s global network of points-of-presence can bring applications much closer to end users without having to bring in an additional content delivery network layer.

We envision NGINX One meeting our customers wherever they are, with a rich ecosystem of supported providers that can be used to seamlessly integrate existing systems, from automation to monitoring and beyond.

NGINX One diagram
Figure 1: NGINX One unites NGINX’s data plane components, a SaaS management console hosted on F5 Distributed Cloud, and pay-as-you-go pricing into a single product offer.

(F5 + NGINX) * SaaS = Better together

F5 and NGINX are truly better together. And bringing our capabilities together will make life easier for everyone, particularly our customers. NetOps and SecOps teams can shift multicloud deployment left to app dev teams without sacrificing security or control. Developers and DevOps teams can more easily experiment and innovate, building and deploying apps more quickly. Best of all, DevOps and platform ops teams, NetOps, and SecOps can better collaborate by utilizing the same set of tools for security, observability, and scalability.

As a SaaS, NGINX One enables our product team to accelerate innovation and feature development. And we can safely and easily make NGINX more extensible, allowing our users to seamlessly integrate NGINX with all their developer tools, CI/CD workflows, and other infrastructure and application delivery systems.

When we brought NGINX into the F5 fold almost five years ago, we had a vision—a single management plane for cloud applications spanning all environments and numerous use cases. We saw a unified system that made it possible for everyone responsible for and dependent on NGINX to use it more easily, securely, and efficiently. It has taken a while. NGINX One is the giant leap on that journey.

Sign up for access and tell us what you think

Today at AppWorld, we are beginning an early access phase with a select group of customers. We are initially inviting existing NGINX customers to participate in these early phases for feedback. As soon as we can, we’ll expand access to more F5 customers and move to general availability later in 2024. Interested NGINX customers can connect with us here and we’ll be in touch soon. We’ll be onboarding additional customers throughout the next several months, and we expect a waiting list to develop.

I want to thank both our NGINX and F5 communities for being so generous with their feedback and time in helping us shape NGINX One. Our work as product builders is principally driven to reflect your needs and wisdom. We hope that you will continue to provide input and guide the future development of NGINX One. We are listening and more excited than ever. Thanks again.

Building the Next NGINX Experience, Designed for the Reality of Modern Apps

As the VP of Product at NGINX, I speak frequently with customers and users. Whether you’re a Platform Ops team, Kubernetes architect, application developer, CISO, CIO, or CTO – I’ve talked to someone like you. In our conversations, you gave me your honest thoughts about NGINX, including our products, pricing and licensing models, highlighting both our strengths and weaknesses.

The core thing we learned is that our “NGINX is the center of the universe” approach does not serve our users well. We had been building products that aimed to make NGINX the “platform” – the unified management plane for everything related to application deployment. We knew that some of our previous products geared towards that goal had been lightly used and adopted. You told us that NGINX is a mission critical component of your existing platform, homegrown or otherwise, but that NGINX was not the platform. Therefore, we needed to integrate better with the rest of your components to make it easier to deploy, manage, secure our products with (and this is important) transparent pricing and consumption models. And to make it all possible via API, of course.

The underlying message was straightforward: make it easier for you to integrate NGINX into your workflows, existing toolchains, and processes in an unopinionated manner. We heard you. In 2024, we will be taking a much more flexible, simple, repeatable, and scalable approach towards use-case configuration and management for data plane and security.

Your desire makes complete sense. Your world has changed and continues to change! You transitioned through various stages, moving from cloud to hybrid to multi-cloud and multi-cloud-hybrid setups. There have also been changes from VMs to Kubernetes, and from APIs to microservices and serverless. Many of you have shifted left and that has led to complexity. More teams have more tools that require more management, observability, and robust security – all powering apps that must be able to scale out in minutes; not hours, days, or weeks. And the latest accelerant, artificial intelligence (AI), puts significant pressure on legacy application and infrastructure architectures.

What We Plan to Address in Upcoming NGINX Product Releases

While the bones of NGINX products have always been rock solid, battle-tested, and performant, the way our users could consume, manage, and observe all aspects of NGINX didn’t keep up with the times. We are moving quickly to remedy that with a new product launch and a slew of new capabilities. We will be announcing more about this at F5’s conference AppWorld 2024, happening February 6 through 8. Here are specific pain points we plan on addressing in upcoming product releases.

Pain Point #1: Modern Apps Are Challenging to Manage Due to the Diversity of Deployment Environments

Today, CIOs and CTOs can pick from a wide variety of application deployment modalities. This is a blessing because it enables far more choice in terms of performance, capabilities, and resilience. It’s also a curse because diversity leads to complexity and sprawl. For example, managing applications running in AWS requires different configurations, tools, and tribal knowledge than managing applications in Azure Cloud.

While containers have standardized, large swathes of application deployment, everything below containers (or going in and out of containers) remains differentiated. As the de facto container orchestration platform, Kubernetes was supposed to clean that process up. But anyone who has deployed on Amazon EKS, Azure Kubernetes Service (AKS), and Google Kubernetes Engine (GKE) can tell you – they’re not at all alike.

You have told us that managing NGINX products across this huge diversity of environments requires significant operational resources and leads to waste. And, frankly, pricing models based on annual licenses collapse in dynamic environments where you might launch an app in a serverless environment, scale it up on a Kubernetes environment, and maintain a small internal deployment running on the cloud for development purposes.

Pain Point #2: Apps Running in Many Environments and Spanning License Types Are Challenging to Secure

The complexity of diverse environments can make it difficult to discover and monitor where modern apps are deployed and then apply the right security measures. Maybe you deployed NGINX Plus as your global load balancer and NGINX Open Source for various microservices, with each running in different clouds or on top of different types of applications. Additionally, they could be requiring different things for privacy, data protection, and traffic management.
Each permutation adds a new security twist. There is no standard, comprehensive solution and that injects operational complexity and potential for configuration errors. Admittedly, we’ve added to that complexity by making it confusing as to which types of security can be applied to which NGINX solutions.

We understand. Customers need a single way to secure all applications that leverage NGINX. This unified security solution must cover the vast majority of use cases and deploy the same tools, dashboards, and operational processes across all cloud, on-prem, serverless, and other environments. We also recognize the importance of moving towards more intelligent security approach, leveraging the collective intelligence of the NGINX community and the unprecedented view of global traffic that we are fortunate to have.

Pain Point #3: Managing the Cost of Modern Apps Is Complex and Results in Waste

In a shift-left world, every organization wants to empower developers and practitioners to do their jobs better, without filing a ticket or sending a Slack. The reality has been different. Some marginal abstraction of complexity has been achieved with Kubernetes, serverless, and other mechanisms for managing distributed applications and applications spanning on-prem, cloud, and multi-cloud environments. But this progress has largely been confined inside the container and application. It has not translated well to the layers around applications like networking, security, and observability, nor to CI/CD.

I have hinted at these issues in the previous pain points, but the bottom line is this: complexity has great costs when it comes to hours and toil, compromised security, and resilience. Maintaining increasingly complex systems is fundamentally challenging and resource intensive. Pricing and license complexity adds another unhappy layer. NGINX has never been a “true-up” company that sticks it to users when they mistakenly overconsume.

But in a world of SaaS, APIs, and microservices, you want to pay as you go and not pay by the year, nor by the seat or site license. You want an easy-to-understand pricing model based on consumption, for all NGINX products and services, across your entire technology infrastructure and application portfolio. You also want a way to incorporate support and security for any open source modules that your teams run, paying for just the bits that you want.

This will require some shifts in how NGINX packages and prices products. The ultimate solution must be simplicity, transparency, and pay-for-what-you-consume, just like any other SaaS. We hear you. And we have something great in store which will address all three of the above pain points.

Join Us at App World 2024

We will be talking about these exciting updates at AppWorld 2024 and will be rolling out pieces of the solution as part of our longer-term plan and roadmap over the next twelve months.

Join me on this journey and tune in to AppWorld for a full breakdown of what’s in store. Early bird pricing is available through January 21. Please check out the AppWorld 2024 registration page for further details. You’re also invited to join NGINX leaders and other members of the community on the night of February 6 at the San Jose F5 office for an evening of looking forward into the future of NGINX, community connections, and indulging in the classics: pizza and swag! See the event page for registration and details.

We hope to see you next month in San Jose!

Tutorial: Configure OpenTelemetry for Your Applications Using NGINX

If you’re looking for a tool to trace web applications and infrastructure more effectively, OpenTelemetry might be just what you need. By instrumenting your NGINX server with the existing OpenTelemetry NGINX community module you can collect metrics, traces, and logs and gain better visibility into the health of your server. This, in turn, enables you to troubleshoot issues and optimize your web applications for better performance. However, this existing community module can also slow down your server’s response times due to the performance overhead it requires for tracing. This process can also consume additional resources, increasing CPU and memory usage. Furthermore, setting up and configuring the module can be a hassle.

NGINX has recently developed a native OpenTelemetry module, ngx_otel_module, which revolutionizes the tracing of request processing performance. The module utilizes telemetry calls to monitor application requests and responses, enabling enhanced tracking capabilities. The module can be conveniently set up and configured within the NGINX configuration files, making it highly user-friendly. This new module caters to the needs of both NGINX OSS and NGINX Plus users. It supports W3C context propagation and OTLP/gRPC export protocol, rendering it a comprehensive solution for optimizing performance.

The NGINX-native OpenTelemetry module is a dynamic module that doesn’t require any additional packaging with NGINX Plus. It offers a range of features, including the API and key-value store modules. These features work together to provide a complete solution for monitoring and optimizing the performance of your NGINX Plus instance. By using ngx_otel_module, you can gain valuable insights into your web application’s performance and take steps to improve it. We highly recommend exploring ngx_otel_module to discover how it can help you achieve better results.

Note: You can head over to our GitHub page for detailed instructions on how to install nginx_otel_module and get started.

Tutorial Overview

In this blog, you can follow a step-by-step guide on configuring OpenTelemetry in NGINX Plus and using the Jaeger tool to collect and visualize traces. OpenTelemetry is a powerful tool that offers a comprehensive view of a request’s path, including valuable information such as latency, request details, and response data. This can be incredibly useful in optimizing performance and identifying potential issues. To simplify things, we have set up the OpenTelemetry module, application, and Jaeger all in one instance, which you can see in the diagram below.

Open Telemetry Module diagram
Figure 1: NGINX OpenTelemetry architecture overview

Follow the steps in these sections to complete the tutorial:

  • Prerequisites
  • Deploy NGINX Plus and Install the OpenTelemetry Module
  • Deploy Jaeger and the echo Application
  • Configure OpenTelemetry in NGINX for Tracing
  • Test the Configuration

Prerequisites

  • A Linux/Unix environment, or any compatible environment
  • A NGINX Plus subscription
  • Basic familiarity with the Linux command line and JavaScript
  • Docker
  • Node.js 19.x or later
  • Curl

Deploy NGINX Plus and Install the OpenTelemetry Module

Selecting an appropriate environment is crucial for successfully deploying an NGINX instance. This tutorial will walk you through deploying NGINX Plus and installing the NGINX dynamic modules.

  1. Install NGINX Plus on a supported operating system.
  2. Install ngx_otel_module. Add the dynamic module to the NGINX configuration directory to activate OpenTelemetry:
  3. load_module modules/ngx_otel_module.so;

  4. Reload NGINX to enable the module:
  5. nginx -t && nginx -s reload

Deploy Jaeger and the echo Application

There are various options available to view traces. This tutorial uses Jaeger to collect and analyze OpenTelemetry data. Jaeger provides an efficient and user-friendly interface to collect and visualize tracing data. After data collection, you will deploy mendhak/http-https-echo, a simple Docker application. This application returns the request attributes for JavaScript in JSON format.

  1. Use docker-compose to deploy Jaeger and the http-echo application. You can create a docker-compose file by copying the configuration below and saving it in a directory of your choice.

    
    version: '3'
    
    Services:
      jaeger:
        image: jaegertracing/all-in-one:1.41
        container_name: jaeger
        ports:
          - "16686:16686"
          - "4317:4317"
          - "4318:4318"
        environment:
          COLLECTOR_OTLP_ENABLED: true
    
      http-echo:
        image: mendhak/http-https-echo
        environment:
            - HTTP_PORT=8888
            - HTTPS_PORT=9999
        ports:
            - "4500:8888" 
            - "8443:9999"
    
  2. To install the Jaeger all-in-one tracing and http-echo application. Run this command:
  3. 'docker-compose up -d'

  4. Run the docker ps -a command to verify if the container is installed.
  5. 
    $docker ps -a
    CONTAINER ID   IMAGE                           COMMAND                  CREATED        STATUS
    PORTS                                                                                                                                                                   NAMES
    
    5cb7763439f8   jaegertracing/all-in-one:1.41   "/go/bin/all-in-one-…"   30 hours ago   Up 30 hours   5775/udp, 5778/tcp, 14250/tcp, 0.0.0.0:4317-4318->4317-4318/tcp, :::4317-4318->4317-4318/tcp, 0.0.0.0:16686->16686/tcp, :::16686->16686/tcp, 6831-6832/udp, 14268/tcp   jaeger
    
    e55d9c00a158   mendhak/http-https-echo         "docker-entrypoint.s…"   11 days ago    Up 30 hours   8080/tcp, 8443/tcp, 0.0.0.0:8080->8888/tcp, :::8080->8888/tcp, 0.0.0.0:8443->9999/tcp, :::8443->9999/tcp                                                                ubuntu-http-echo-1
    

    You can now access Jaeger by simply typing in the http://localhost:16686 endpoint in your browser. Note that you might not be able to see any system trace data right away as it is currently being sent to the console. But don’t worry! We can quickly resolve this by exporting the traces in the OpenTelemetry Protocol (OTLP) format. You’ll learn to do this in the next section when we configure NGINX to send the traces to Jaeger.

Configure OpenTelemetry in NGINX for Tracing

This section will show you step-by-step how to set up the OpenTelemetry directive in NGINX Plus using a key-value store. This powerful configuration enables precise monitoring and analysis of traffic, allowing you to optimize your application’s performance. By the end of this section, you will have a solid understanding of utilizing the NGINX OpenTelemetry module to track your application’s performance.

Setting up and configuring telemetry collection is a breeze with NGINX configuration files. With ngx_otel_module, users can access a robust, protocol-aware tracing tool that can help to quickly identify and resolve issues in applications. This module is a valuable addition to your application development and management toolset and will help you enhance the performance of your applications. To learn more about configuring other OpenTelemetry sample configurations, please refer to the documentation ngx_otel_module documentation.

OpenTelemetry Directives and Variables

NGINX has new directives that can help you achieve an even more optimized OpenTelemetry deployment, tailored to your specific needs. These directives were designed to enhance your application’s performance and make it more efficient than ever.

Module Directives:

  1. otel_exporter – Sets the parameters for OpenTelemetry data, including the endpoint, interval, batch size, and batch count. These parameters are crucial for the successful export of data and must be defined accurately.
  2. otel_service_name – Sets the service name attribute for your OpenTelemetry resource to improve organization and tracking.
  3. otel_trace – To enable or disable OpenTelemetry tracing, you can now do so by specifying a variable. This offers flexibility in managing your tracing settings.
  4. otel_span_name – The name of the OpenTelemetry span is set as the location name for a request by default. It’s worth noting that the name is customizable and can include variables as required.

Configuration Examples

Here are examples of ways you can configure OpenTelemetry in NGINX using the NGINX Plus key-value store. The NGINX Plus key-value store module offers a valuable use case that enables dynamic configuration of OpenTelemetry span and other OpenTelemetry attributes, thereby streamlining the process of tracing and debugging.

This is an example of dynamically enabling OpenTelemetry tracing by using a key-value store:


http {
      keyval "otel.trace" $trace_switch zone=name;

      server {
          location / {
              otel_trace $trace_switch;
              otel_trace_context inject;
              proxy_pass http://backend;
          }

          location /api {
              api write=on;
          } 
      }
  }

Next, here’s an example of dynamically disabling OpenTelemetry tracing by using a key-value store:


location /api {
              api write=off;
          } 

Here is an example NGINX OpenTelemetry span attribute configuration:


user  nginx;
worker_processes  auto;
load_module modules/ngx_otel_module.so;
error_log /var/log/nginx debug;
pid   /var/run/nginx.pid;


events {
    worker_connections  1024;
}

http {
    keyval "otel.span.attr" $trace_attr zone=demo;
    keyval_zone zone=demo:64k  state=/var/lib/nginx/state/demo.keyval;

    log_format  main  '$remote_addr - $remote_user [$time_local] "$request" '
                      '$status $body_bytes_sent "$http_referer" '
                      '"$http_user_agent" "$http_x_forwarded_for"';
    include       mime.types;
    default_type  application/json;
    upstream echo {
        server localhost:4500;
        zone echo 64k;
    }
    otel_service_name nginx;
    otel_exporter {
           endpoint localhost:4317;
        }

    server {
       listen       4000;
       otel_trace on;
       otel_span_name otel;
       location /city {
            proxy_set_header   "Connection" "" ;
            proxy_set_header Host $host;
            otel_span_attr demo $trace_attr;
            otel_trace_context inject;
            proxy_pass http://echo;
       }
       location /api {
           api write=on;
       }
       location = /dashboard.html {
        root /usr/share/nginx/html;
    }
       
  }

}

To save the configuration and restart NGINX, input this code:

nginx -s reload

Lastly, here is how to add span attribute in NGINX Plus API:


curl -X POST -d '{"otel.span.attr": "<span attribute name>"}' http://localhost:4000/api/6/http/keyvals/<zone name>

Test the Configuration

Now, you can test your configuration by following the steps below.

  1. To generate the trace data, start by opening your terminal window. Next, type in this command to create the data:

    $ curl -i localhost:4000/city

    The output will look like this:

                          
    HTTP/1.1 200 OK
    Server: nginx/1.25.3
    Date: Wed, 29 Nov 2023 20:25:04 GMT
    Content-Type: application/json; charset=utf-8
    Content-Length: 483
    Connection: keep-alive
    X-Powered-By: Express
    ETag: W/"1e3-2FytbGLEVpb4LkS9Xt+KkoKVW2I"
    
    {
    "path": "/city",
    "headers": {
    "host": "localhost",
    "connection": "close",
    "user-agent": "curl/7.81.0",
    "accept": "*/*",
    "traceparent": "00-66ddaa021b1e36b938b0a05fc31cab4a-182d5a6805fef596-00"
    },
    "method": "GET",
    "body": "",
    "fresh": false,
    "hostname": "localhost",
    "ip": "::ffff:172.18.0.1",
    "ips": [],
    "protocol": "http",
    "query": {},
    "subdomains": [],
    "xhr": false,
    "os": {
    "hostname": "e55d9c00a158"
    },
    "connection": {}
    
  2. Now you want to ensure that the OTLP exporter is functioning correctly and that you can gain access to the trace. Start by opening a browser and accessing the Jaeger UI at http://localhost:16686. Once the page loads, click on the Search button, located in the title bar. From there, select the service that starts with NGINX from the drop-down menu in the Service field. Then select the operation named Otel from the drop-down menu called Operation. To make it easier to identify any issues, click on the Find Traces button to visualize the trace.
  3. Jaeger dashboard
    Figure 2: Jaeger dashboard
  4. To access a more detailed and comprehensive analysis of a specific trace, click on one of the individual traces available. This will provide you with valuable insights into the trace you have selected. In the trace below, you can review both the OpenTelemetry directive span attribute and the non-directive of the trace, allowing you to better understand the data at hand.
  5. Analysis of the OpenTelemetry trace
    Figure 3: Detailed analysis of the OpenTelemetry trace

    Under Tags you can see the following attributes:

    • demo – OTel – OpenTelemetry span attribute name
    • http.status_code field – 200 – Indicates successful creation
    • otel.library.name – nginx – OpenTelemetry service name

Conclusion

NGINX now has built-in support for OpenTelemetry, a significant development for tracing requests and responses in complex application environments. This feature streamlines the process and ensures seamless integration, making it much easier for developers to monitor and optimize their applications.

Although the OpenTracing module that was introduced in NGINX Plus R18 is now deprecated and will be removed starting from NGINX Plus R34, it will still be available in all NGINX Plus releases until then. However, it’s recommended to use the OpenTelemetry module, which was introduced in NGINX Plus R29.

If you’re new to NGINX Plus, you can start your 30-day free trial today or contact us to discuss your use cases.

A Quick Guide to Scaling AI/ML Workloads on Kubernetes

When running artificial intelligence (AI) and machine learning (ML) model training and inference on Kubernetes, dynamic scaling up and down becomes a critical element. In addition to requiring high-bandwidth storage and networking to ingest data, AI model training also needs substantial (and expensive) compute, mostly from GPUs or other specialized processors. Even when leveraging pre-trained models, tasks like model serving and fine-tuning in production are still more compute-intensive than most enterprise workloads.

Cloud-native Kubernetes is designed for rapid scalability – up and down. It’s also designed to deliver more agility and cost-efficient resource usage for dynamic workloads across hybrid, multi-cloud environments.

In this blog, we cover the three most common ways to scale AI/ML workloads on Kubernetes so you can achieve optimal performance, cost savings, and adaptability for dynamic scaling in diverse environments.

Three Scaling Modalities for AI/ML Workloads on Kubernetes

The three common ways Kubernetes scales a workload are with the Horizontal Pod Autoscaler (HPA), Vertical Pod Autoscaler (VPA), and Cluster Autoscaler.

Here is a breakdown of those three methods:

  • HPA – The equivalent of adding instances or pod replicas to an application, giving it more scale, capacity, and throughput.
  • VPA – The equivalent of resizing a pod to give it higher capacity with greater compute and memory.
  • Cluster Autoscaler – Automatically increases or decreases the number of nodes in a Kubernetes cluster depending on the current resource demand for the pods.

Each modality has its benefits for model training and inferencing, which you can explore in the use cases below.

HPA Use Cases

In many cases, distributed AI model training and inference workloads can scale horizontally (i.e., adding more pods to speed up the training process or request handling). This enables the workloads benefit from HPA, which can scale out the number of pods based on metrics like CPU and memory usage, or even custom and external metrics relevant to the workload. In scenarios where the workload varies over time, HPA can dynamically adjust the number of pods to ensure optimal resource utilization.

Another aspect of horizontally scaling AI workloads in Kubernetes is load balancing. To ensure optimal performance and timely request processing, incoming requests need to be distributed across multiple instances or pods. This is why one of the ideal tools that can be used in conjunction with HPA is an Ingress controller.

Kubernetes with Ingress Controller diagram

VPA Use Cases

AI model training tasks are often resource-intensive, requiring significant CPU, GPU, and memory resources. VPA can adjust these resource allocations dynamically. This helps ensure that each pod has enough resources to efficiently handle the training workload and that all assigned pods have sufficient compute capacity to perform calculations. In addition, memory requirements can fluctuate significantly during the training of large models. VPA can help prevent out-of-memory errors by increasing the memory allocation as needed.

While it’s technically possible to use both HPA and VPA together, it requires careful configuration to avoid conflicts, as they might try to scale the same workload in different ways (i.e., horizontally versus vertically). It’s essential to clearly define the boundaries for each autoscaler, ensuring they complement rather than conflict with each other. An emerging approach is to use both with different scopes – for instance, HPA for scaling across multiple pods based on workload and VPA for fine-tuning the resource allocation of each pod within the limits set by HPA.

Cluster Autoscaler Use Cases

Cluster Autoscaler can help dynamically adjust the overall pool of compute, storage, and networking infrastructure resources available cluster-wide to meet the demands of AI /ML workloads. By adjusting the number of nodes in a cluster based on current demands, an organization can load balance at the macro level. This is necessary to ensure optimal performance as AI/ML workloads can demand significant computational resources unpredictably.

HPA, VPA, and Cluster Autoscaler Each Have a Role

In summary, these are the three ways that Kubernetes autoscaling works and benefits AI workloads:

  • HPA scales AI model serving endpoints that need to handle varying request rates.
  • VPA optimizes resource allocation for AI/ML workloads and ensures each pod has enough resources for efficient processing without over-provisioning.
  • Cluster Autoscaler adds nodes to a cluster to ensure it can accommodate resource-intensive AI jobs or removes nodes when the compute demands are low.

HPA, VPA and Cluster Autoscaler complement each other in managing AI/ML workloads in Kubernetes. Cluster Autoscaler ensures there are enough nodes to meet workload demands, HPA efficiently distributes workloads across multiple pods, and VPA optimizes the resource allocation of these pods. Together, they provide a comprehensive scaling and resource management solution for AI/ML applications in Kubernetes environments.

Visit our Power and Protect Your AI Journey page to learn more on how F5 and NGINX can help deliver, secure, and optimize your AI/ML workloads.

Join F5 NGINX at AppWorld 2024

Happy new year! With every turn of the annual calendar comes a sense of renewal. This year, we’re feeling especially invigorated because 2024 is already shaping up to be a monumental year for F5 – and for F5 NGINX in particular. To kick it off, we want to invite you to join us for AppWorld 2024 at the McEnery Convention Center in San Jose, CA from February 6 through 8.

What Is AppWorld?

AppWorld is the reinvention of F5’s flagship event, formerly known as Agility. It’s hard to believe, but it has been more than five years since we last hosted an event in person, and so much has changed in that timespan. While we carried on with Agility as a virtual event in the interim, we recognize that there is no virtual substitute for the deep learning and rich experience that comes from a dynamic in-person gathering.

Attendees of AppWorld 2024 will have more than sixty sessions to choose from, and you can tailor an agenda that interests you and fits the needs of your organization. We will offer:

  • F5 leadership keynote sessions featuring our customers and partners
  • Breakout sessions and labs on specific topics of technical learning
  • Ample opportunities to connect and socialize with fellow attendees and F5 employees

Join us at the event to discover what is possible with F5 and NGINX’s suite of solutions. F5 is the only company that can secure every app and API everywhere, and AppWorld will provide the opportunity for you to learn firsthand about F5’s plans and how NGINX complements them.

Exciting Announcement for NGINX

What we are most excited about is that NGINX will announce the biggest product leap in our history at AppWorld. This major announcement will focus on a significant reshaping of our product portfolio that will provide a simple, straightforward, and uniform path for scaling modern applications within the complex rigors of the modern enterprise. NGINX General Manager Shawn Wormke will unveil this exciting news during his keynote address on February 7.

More Reasons to Attend AppWorld 2024

Beyond this big announcement, there are plenty of other great reasons to attend AppWorld.

AppWorld features four topical breakout tracks that encapsulate F5’s broad portfolio, including one exclusively devoted to NGINX. The NGINX track will feature sessions designed to help you and your organization drive innovation and recognize value from NGINX products and the broader F5 portfolio.

NGINX has long been the world’s most popular web server as well as a preferred tool for organizations looking to deploy and secure web apps and APIs in any environment. We hope you will take this unique opportunity to learn what’s new and what’s next, as well as how we plan to transform NGINX into a solution that is even more powerful and easy-to-use for developers, architects, and network and security professionals.

Register Today

Early bird pricing is available through January 21. Please check out the AppWorld 2024 registration page for further details. Also, you’re invited to join NGINX leaders and other members of the community on the night of February 6 at the San Jose F5 office for an evening of looking forward into the future of NGINX, community connections, and indulging in the classics: pizza and swag! See the event page for registration and details. We hope to see you next month in San Jose!

Announcing NGINX Plus R31

We’re happy to announce the availability of NGINX Plus Release 31 (R31). Based on NGINX Open Source, NGINX Plus is the only all-in-one software web server, load balancer, reverse proxy, content cache, and API gateway.

New and enhanced features in NGINX Plus R31 include:

  • Native NGINX usage reporting – NGINX Plus now has native support for reporting on NGINX deployments across your organization, enabling a consolidated view of your NGINX infrastructure in NGINX Instance Manager. This feature enables enhanced governance of NGINX instances for compliance purposes.
  • Enhancements to SNI configuration – Previously, the server name that passed through Server Name Identification (SNI) used the proxy_ssl_name directive and was used by all the servers in the upstream group. NGINX Plus R31 enables this SNI to be set to a selected upstream server.
  • Periodic task execution with NGINX JavaScript – NGINX JavaScript introduces the js_periodic directive to allow running content at periodic intervals. This enhancement eliminates the need to set up a cron job and can be configured to run on all or specific worker processes for optimal performance.
  • A better NGINX startup experience – NGINX Plus R31 brings in improvements in the overall NGINX startup experience in cases where there are a high number of “locations” in the configuration.
  • QUIC+HTTP/3 optimizations and improvements – NGINX Plus R31 adds many enhancements and performance optimizations to the QUIC implementation, including support for path maximum transmission unit (MTU) discovery, congestion control improvements, and the ability to reuse the cryptographic context across your entire QUIC session.

Rounding out the release are new features and bug fixes inherited from NGINX Open Source and updates to the NGINX JavaScript module.

Important Changes in Behavior

Note: If you are upgrading from a release other than NGINX Plus R30, be sure to check the Important Changes in Behavior section in previous announcement blogs for all releases between your current version and this one.

Deprecation of the OpenTracing Module

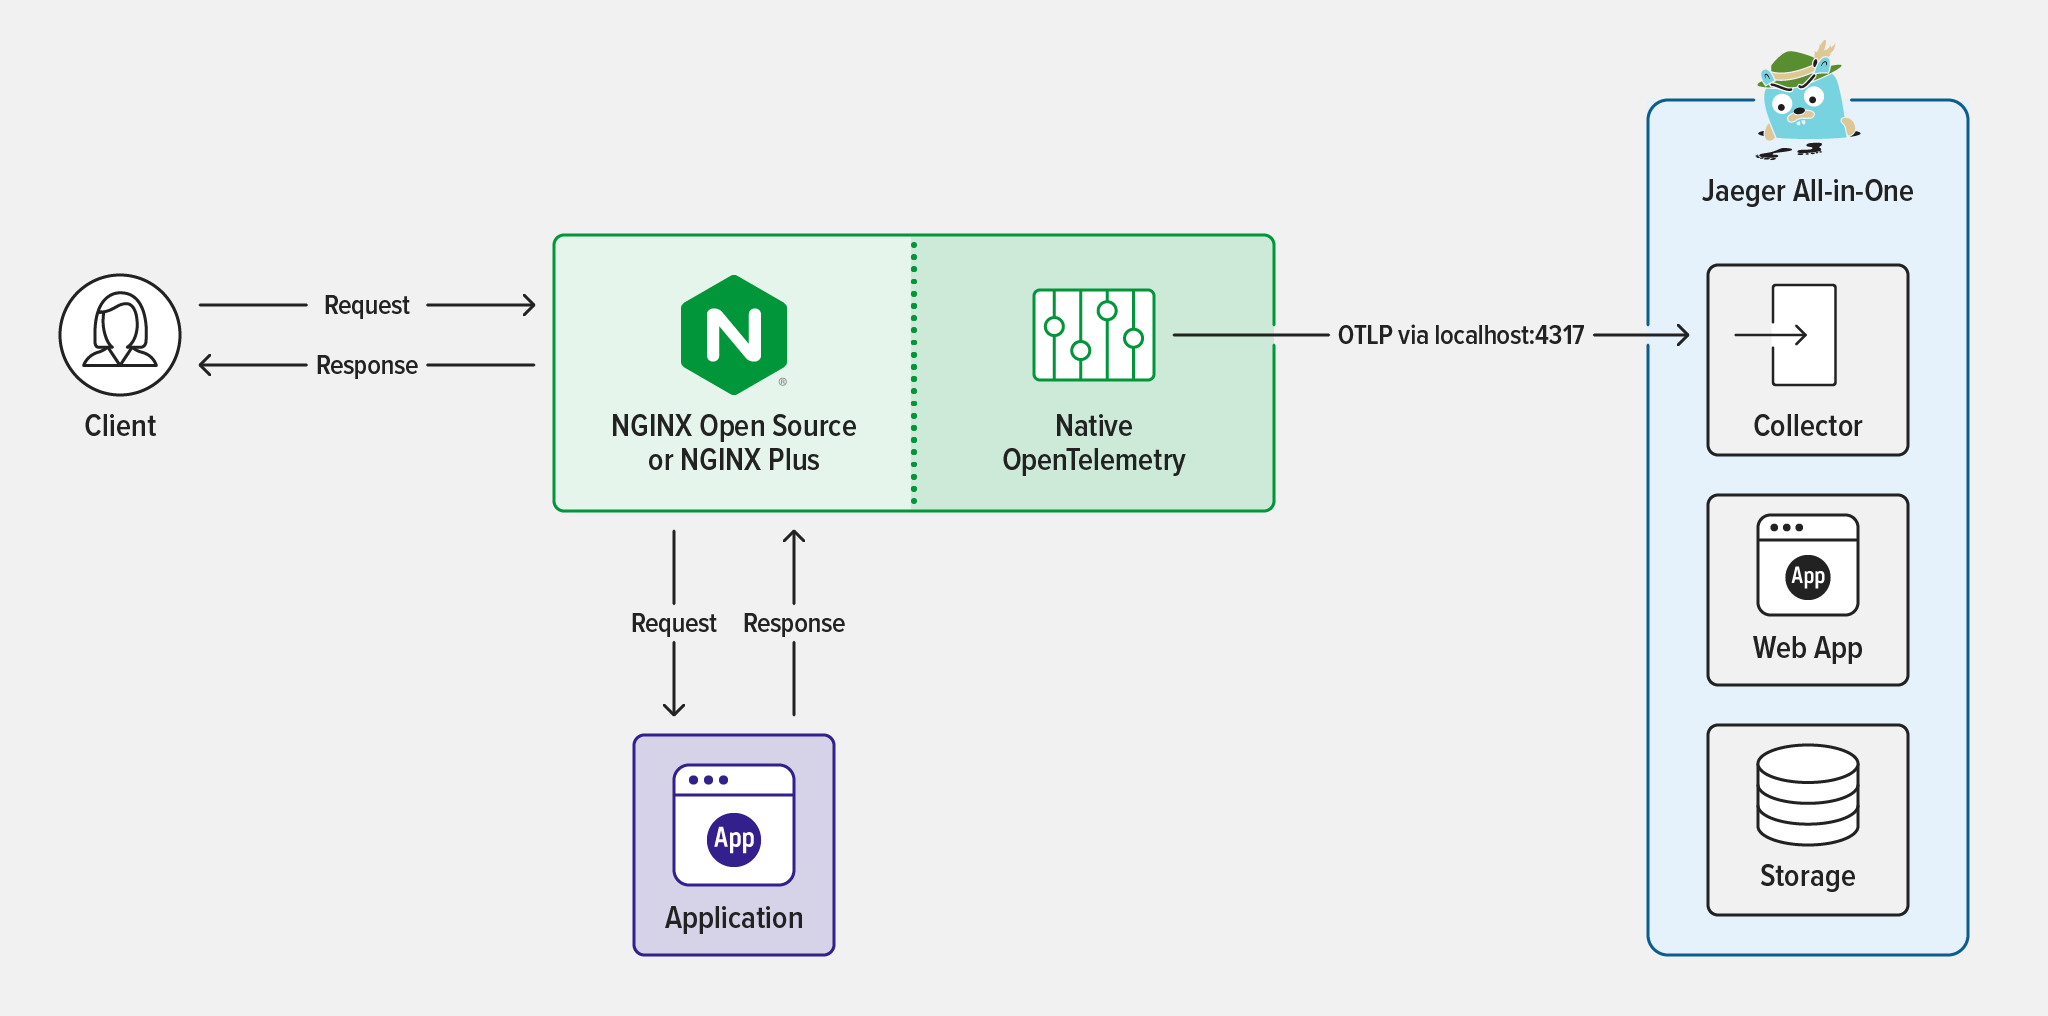
The OpenTracing module that was introduced in NGINX Plus R18 is now being deprecated. It is marked to be removed starting in the future release of NGINX Plus R34. The package will be made available with all NGINX Plus releases until then. It is strongly advised to use the OpenTelemetry module that was introduced in NGINX Plus R29.

Warning Message for Not Reporting NGINX Usage

NGINX Plus users are required to report their NGINX usage to F5 for compliance purposes. With the release of NGINX Plus R31, the ability to report your NGINX usage to NGINX Instance Manager is natively present and is enabled by default. A warning message is logged if the NGINX instance is not able to provide its usage information to NGINX Instance Manager for any reason.

Refer to the Native NGINX Usage Reporting section for details on how to configure this feature in your environment.

Changes to Platform Support

New operating systems supported:

  • FreeBSD 14
  • Alpine 3.19

Older operating systems removed:

  • Alpine 3.15, which reached end-of-life (EOL) on Nov 1, 2023

Older operating systems deprecated and scheduled for removal in NGINX Plus R32:

  • FreeBSD 12 which will reach EOL on Dec 31, 2023

New Features in Detail

Native NGINX Usage Reporting

NGINX Plus R31 introduces native communication with NGINX Instance Manager on your network to automate licensing compliance. If you participate in the F5 Flex Consumption Program, you will no longer need to manually track your NGINX Plus instances.

By default, NGINX Plus will attempt to discover NGINX Instance Manager on startup via a DNS lookup of the nginx-mgmt.local hostname. While the hostname is configurable, we suggest (for simplicity) to add an A record to your local DNS, associating the default hostname with the IP address of the system running NGINX Instance Manager. NGINX Plus will then establish a TLS connection to NGINX Instance Manager, reporting its version number, hostname, and unique identifier every thirty minutes.

For an added layer of security, we also suggest provisioning this connection with mTLS by using the optional mgmt configuration block. At a regular cadence, NGINX Instance Manager will then report the total usage of NGINX Plus instances to an F5 service.

You will see a warning message in your error log if NGINX Plus experiences any problems resolving the nginx-mgmt.local hostname or communicating with NGINX Instance Manager.

This is an example of an error message indicating that the NGINX Plus instance is unable to resolve nginx-mgmt.local:

2023/12/21 21:02:01 [warn] 3050#3050: usage report: host not found resolving endpoint "nginx-mgmt.local”

And here is an example of an error message indicating that the NGINX Plus instance is experiencing difficulties communicating with NGINX Instance Manager:

2023/12/21 21:02:01 [warn] 3184#3184: usage report: connection timed out

Customizing the mgmt Configuration Block Settings

If you prefer to fine tune how your NGINX Plus instance communicates with NGINX Instance Manager, you may opt to use the new mgmt configuration block and associated directives. Doing so allows you to define a custom resolver, use an IP address or alternate hostname to identify your NGINX Instance Manager system, specify TLS options, use mTLS for enhanced security, and specify other custom parameters.

The following is a sample custom configuration:

mgmt {
    usage_report endpoint=instance-manager.local interval=30m;
    resolver 192.168.0.2; # Sample internal DNS IP

    uuid_file /var/lib/nginx/nginx.id;

    ssl_protocols TLSv1.2 TLSv1.3;
    ssl_ciphers DEFAULT;

    ssl_certificate          client.pem;
    ssl_certificate_key      client.key;

    ssl_trusted_certificate  trusted_ca_cert.crt;
    ssl_verify               on;
    ssl_verify_depth         2;
}

For additional details on these directives, please see the product documentation.

For more information on downloading and installing NGINX Instance Manager, see the installation guide.

Note: If you are using an earlier version of NGINX Plus, you can still report your instances by following these instructions.

Enhancements to SNI Configuration

Prior to this release, NGINX Plus assumed that all servers in an upstream group were identical. This means they needed to be able to answer the same requests, respond to the same SNI name (when proxy_ssl_server_name is used), and return SSL certificates matching the same name.

However, scenarios exist where this behavior is not sufficient. For ex. if multiple virtual servers are shared behind an upstream server and need to be distinguished by a different SNI and/or host header to route requests to specific resources. It’s also possible that the same certificate can’t be used on all servers in the upstream group or there are limitations to put upstream servers into separate upstream groups.

NGINX Plus R31 introduces support for SNI to be configured per upstream server. The variable $upstream_last_server_name refers to the name of the selected upstream server, which can then be passed to the proxied server using the proxy_ssl_server_name and proxy_ssl_name directives.

Here is how you set proxy_ssl_server_name to on, enabling a server name to pass through SNI:
proxy_ssl_server_name on;

And this is how to pass the selected upstream server name using proxy_ssl_name:
proxy_ssl_name $upstream_last_server_name;

Periodic Task Execution with NGINX JavaScript

NGINX JavaScript v0.8.1 introduced a new directive js_periodic that is available in both the http and stream contexts. This directive allows specifying a JavaScript content handler to run at regular intervals. This is useful in cases where custom code needs to run at periodic intervals and might require access to NGINX variables. The content handler receives a session object as an argument and also has access to global objects.

By default, the content handler runs on worker process 0, but it can be configured to run on specific or all worker processes.

This directive is available in the location context:

example.conf:

location @periodics {

    # to be run at 15 minute intervals in worker processes 1 and 3
    js_periodic main.handler interval=900s worker_affinity=0101;

    resolver 10.0.0.1;
    js_fetch_trusted_certificate /path/to/certificate.pem;
}

example.js:

async function handler(s) {
    let reply = await ngx.fetch('https://nginx.org/en/docs/njs/');
    let body = await reply.text();

    ngx.log(ngx.INFO, body);
}

For syntax and configuration details, please refer to the NGINX JavaScript docs.

A Better NGINX Startup Experience

In scenarios where an NGINX configuration contains a high number of “locations,” your NGINX startup time may take a considerable amount of time. In many cases, this might not be acceptable. The root issue exists in the sorting algorithm that is used to sort the list of locations.

NGINX R31 introduces an enhancement that swaps out the existing sorting algorithm from insertion sort, which has a time complexity of O(n2), to merge sort with a time complexity of O(n*log n).

In a test configuration with 20,000 locations, it was observed that the total startup time was reduced from 8 seconds to 0.9 seconds after this update.

QUIC+HTTP/3 Optimizations and Improvements

NGINX Plus R31 introduces several enhancements and performance optimizations to the QUIC+HTTP/3 implementation, such as:

  • Path maximum transmission unit (MTU) discovery when using QUIC+HTTP/3 – Path MTU is a measurement in bytes of the largest size frame or data packet that can be transmitted across a network. Prior to this change, the QUIC implementation used a path MTU of 1200 bytes for all datagrams. NGINX Plus now has support to discover the path MTU size, which is then used for all outgoing datagrams.
  • Reuse cryptographic context across the entire QUIC session – This optimization relates to the encryption and decryption behavior of QUIC packets. Previously, a separate cryptographic context was created for each encryption or decryption operation. Now, the same context gets used across the whole QUIC session, resulting in better performance.

Additional performance optimizations include reducing potential delays when sending acknowledgement packets, putting acknowledgement (ACK) frames in the front of the queue to reduce frame retransmissions and delays in delivery of ACK frames, and improvements to the congestion control behavior in Generic Segmentation Offload (GSO) mode.

Other Enhancements and Bug Fixes in NGINX Plus R31

Additional mgmt Module

In NGINX Plus R31, ngx_mgmt_module enables you to report NGINX usage information to NGINX Instance Manager. This information includes the NGINX hostname, NGINX version, and a unique instance identifier.

The module provides several directives to fine tune how your NGINX instance communicates with NGINX Instance Manager. For a complete list of available directives and configuration options, refer to the NGINX Docs.

Bug Fixes in the MQTT Module

Message Queuing Telemetry Transport (MQTT) support was introduced in NGINX Plus R29 and this release contains a few bug fixes for issues observed in the MQTT module.

One important fix addresses an issue of CONNECT messages being rejected when a password was not provided. Previously, we unconditionally expected that the username field would be followed by password. There are, however, special cases in the MQTT specification – such as anonymous authentication – where providing a password is not mandatory. The fix conditionally checks if the password is expected or not by looking at the cflags field of the packet. If the flag is not set, it implies that the password is not mandatory.

Another bug fix stops the parsing of MQTT CONNECT messages when the message length is less than the number of bytes received.

HTTP/3 server_tokens support with variables

NGINX Plus R31 adds support for missing server_tokens variables for HTTP/3 connections. The string field can be used to explicitly set the signature on error pages and the “Server” response header field value. If the string field is empty, it disables the emission of the “Server” field.

Changes Inherited from NGINX Open Source

NGINX Plus R31 is based on NGINX Open Source 1.25.3 and inherits functional changes, features, and bug fixes made since NGINX Plus R30 was released (in NGINX 1.25.2 and 1.25.3).

Features

  • Path MTU discovery when using QUIC – Previously, a default size of 1200 MTU was used for all datagrams. As part of the QUIC+HTTP/3 improvements, we added support to discover the path MTU size which is then used for all outgoing datagrams.
  • Performance optimizations in QUIC – NGINX mainline version 1.25.2 introduced optimizations in the QUIC implementation to reuse the cryptographic context for the entire QUIC session. This reduces delays in sending ACK packets and puts ACK frames in the front of the queue to lessen frame retransmissions and delays in delivery of ACK frames.
  • Support for the TLS_AES_128_CCM_SHA256 cipher suite when using HTTP/3 – This enhancement adds TLS_AES_128_CCM_SHA256 support to QUIC, which currently is the only cipher suite not supported by the NGINX QUIC implementation. It’s disabled by default in OpenSSL and can be enabled with this directive: ssl_conf_command Ciphersuites TLS_AES_128_CCM_SHA256;
  • Provide nginx appName while loading OpenSSL configs – When using the OPENSSL_init_ssl() interface, instead of checking OPENSSL_VERSION_NUMBER, NGINX now tests for OPENSSL_INIT_LOAD_CONFIG to be defined and true. This ensures that the interface is not used with BoringSSL and LibreSSL, as they do not provide additional library initialization settings (notably, the OPENSSL_INIT_set_config_appname() call).

Changes

  • Change to the NGINX queue sort algorithm – As detailed above, NGINX now uses merge sort, which has a time complexity of O(n*log n). This creates a better NGINX startup experience, especially when there is a very high number of “locations” in the configuration.
  • HTTP/2 iteration stream handling limit – This improvement ensures early detection of flood attacks on NGINX by imposing a limit on the number of new streams that can be introduced in one event loop. This limit is twice the value and is configured using http2_max_concurrent_streams. It is applied even if the maximum threshold of allowed concurrent streams is never reached to account for cases when streams are reset immediately after sending the requests.

Bug Fixes

  • Fixed buffer management with HTTP/2 autodetection – As part of HTTP/2 autodetection on plain TCP connections, initial data is first read into a buffer specified by the client_header_buffer_size directive that does not have state reservation. This caused an issue where the buffer could be overread while saving the state. The current fix allows reading only the available buffer size instead of the fixed buffer size. This bug first appeared in NGINX mainline version 1.25.1 (NGINX Plus R30).
  • Incorrect transport mode in OpenSSL compatibility mode – Prior to this release, the OpenSSL Compatibility Layer caused the connection to delay, in the event that an incorrect transport parameter was sent by the client. The fix effortlessly handles this behavior by first notifying the user about the incorrect parameter and subsequently closing the connection.
  • Fixed handling of tatus headers without reason-phrase – A status header with an empty “reason phrase” like Status: 404 was valid per Common Gateway Interface (CGI) specification but lost the trailing space during parsing. This resulted in an HTTP/1.1 404 status line in the response, which violates HTTP specification due to a missing trailing space. With this bug fix, only the status code is used from such short Status header lines, so NGINX will generate the status line itself with the space and appropriate reason phrase if available.
  • Fixed memory leak on configuration reloads with PCRE2 – This issue occurred when NGINX was configured to use PCRE2 in version 1.21.5 or higher.

For the full list of new changes, features, bug fixes, and workarounds inherited from recent releases, see the NGINX CHANGES file.

Changes to the NGINX JavaScript Module

NGINX Plus R31 incorporates changes from the NGINX JavaScript (njs) module version 0.8.2. Here is the list of noticeable changes in njs since 0.8.0 (which was the part of NGINX Plus R30 release).

Features

  • Introduced console object. These methods were introduced: error(), info(), log(), time(), timeEnd(), and warn().
  • Introduced the js_periodic directive for http and stream that allows specifying a JS handler to run at regular intervals.
  • Implemented items() method of a shared dictionary. This method returns all the non-expired key-value pairs.

Changes

  • Extended the “fs” module. Added existsSync() method.

Bug Fixes

  • Fixed the “xml” module. Fixed broken XML exception handling in parse() method.
  • Fixed RegExp.prototype.exec() with global regular expression (regexp) and Unicode input.
  • Fixed size(), and keys() methods of a shared dictionary.
  • Fixed erroneous exception in r.internalRedirect() that was introduced in 0.8.0.
  • Fixed incorrect order of keys in Object.getOwnPropertyNames().
  • Fixed HEAD response handling with large Content-Length in fetch API.
  • Fixed items() method for a shared dictionary.

For a comprehensive list of all the features, changes, and bug fixes, see the njs Changes log.

Upgrade or Try NGINX Plus

If you’re running NGINX Plus, we strongly encourage you to upgrade to NGINX Plus R31 as soon as possible. In addition to all the great new features, you’ll also pick up several additional fixes and improvements, and being up to date will help NGINX to help you if you need to raise a support ticket.

If you haven’t tried NGINX Plus, we encourage you to check it out. You can use it for security, load balancing, and API gateway use cases, or as a fully supported web server with enhanced monitoring and management APIs. Get started today with a free 30-day trial.

Managing Your NGINX Configurations with GitHub

Software settings, options, and configurations exist in many different forms. At one end of the spectrum are the slick, responsive GUIs meant to be intuitive while providing guardrails against invalid states. On the other end: text files. While text files are lauded by both engineers and DevOps teams for their clarity, automation potential, and minimal usage requirements (you likely have a few open terminal windows, right?), there are clear trade-offs to configuring software with them. For example, try to find a Linux user who hasn’t managed to crash a software package by misconfiguring a text file.

As the only all-in-one software proxy, load balancer, web server and API gateway, NGINX is a key component of modern internet infrastructure. An infrastructure that is, in most cases, based on operating systems underpinned by the Linux kernel. To conform to this ecosystem and the professionals supporting it, NGINX relies heavily on text-based configurations.

The F5 NGINX Instance Manager module has long been the go-to for NGINX-related config orchestration. It provides advanced capabilities for remote, batch configuration management through its intuitive user interface and API, with supporting documentation and guardrails to boot. However, individual NGINX configuration files strongly resemble code and software teams already have an amazing tool for managing code: Git. Git provides developers and operations teams a slew of features geared towards managing text file workflows.

Instance Manager’s new integration with Git and other external systems enables features like version control, decentralized contribution, approval workflows, and team coordination. Platforms like GitHub and GitLab extend this feature set to continuous integration/continuous deployment (CI/CD), collaboration, issue tracking, and other valuable functions through a web-based user interface.

In this blog post we illustrate how GitHub can be used to manage NGINX configurations, automatically pushing them to instances whenever a change is made.

Instance Manager API

Instance Manager provides a rich set of REST APIs that complement its web user interface. A key benefit to the API is its ability to update configuration files of data plane instances under management. Recently, we extended this functionality by enabling the ability to tie configuration updates to a specific version of the file. When managed in a Git repository, configurations can be tagged with a Git commit hash. Additionally, we implemented a new state within Instance Manager for externally managed configs that warns would-be file editors that configurations are under external management.

GitHub Actions

GitHub allows developers to create custom deployment pipelines in their repositories using a feature called Actions. A user may choose to define their own actions or invoke existing scripts via a YAML definition. These pipelines can be triggered in a variety of ways, like when a repository is updated with a commit or a pull request merge.

In this blog’s example, we lean on out-of-the-box GitHub Actions and Linux commands. You will learn to use them to update GitHub-managed NGINX configuration files on your NGINX instances via the Instance Manager API. To start, follow these steps on GitHub Docs to create a new YAML for running Actions in your repository.

Setting Actions Secrets

Instance Manager supports various forms of authentication. In the example, we use the Basic Authentication method, though we recommend provisioning OIDC authentication in production environments.

Rather than storing Instance Manager credentials in the repository, GitHub allows you to define secrets as repository variables. These variables are accessible by the Actions environment but hidden in logs. Follow these steps to store Instance Manager username and password keys as secrets so you can use them to authenticate your API calls.

Here, we’ve set these variables to NMS_USERNAME and NMS_PASSWORD.

Screenshot of a tech platform displaying repository secrets options

Setting Actions Variables

Similarly, rather than defining constant variables in your YAML, it can be helpful to factor them out for management in the GitHub user interface. On the Variables page, you can find instructions on how to define variables that span all repository Actions. In the example, we use this opportunity to define the Instance Manager FQDN or IP (NMS_HOSTNAME), identifier of the system NGINX is running on (SYSTEM_ID), and identifier of the specific NGINX instance to be updated (INSTANCE_ID).

Screenshot of a tech platform displaying repository variables options

Note: We’ve set these variables to simplify our example, but you may choose to manage Instance Manager, System, and NGINX identifying information in other ways. For instance, you may opt to create directories in your repository containing configurations specific to different instances and name these directories with system or instance IDs. You could then modify your YAML or Action script to read directory names and update configuration files on the corresponding instance.

Anatomy of the Instance Manager REST API Call for Updating NGINX Configurations

The Instance Manager configuration update REST API call requires several key components to work. Your YAML will need to define each of these parameters and package them into the API call in the proper format.

In the example, we use the API call for updating a single instance. However, it’s also possible to configure an instance group within Instance Manager. Doing so enables you to update all instances in a group whenever a new configuration is pushed from GitHub. For more information, please see our How-To Guide on publishing configurations.

Below is a breakdown of Instance Manager’s configuration update REST API call:


https://{INSTANCE MANAGER HOSTNAME}/api/platform/v1/systems/{SYSTEM ID}/instances/{INSTANCE ID}/config' 
--header "accept: application/json" 
--header "Authorization: Basic {LOGIN CREDENTIALS}" 
--header 'Content-Type: application/json'
--data '{
    "configFiles": '{
        "rootDir": "/etc/nginx",
        "files": [{
            "contents": "{NGINX CONFIGURATION FILE}",
            "name": "{PATH TO CONFIGURATION FILE ON SYSTEM}"
        }]
    },
    "externalIdType": "{SOURCE OF CONFIGS}",
    "externalId": "{COMMIT HASH}",
    "updateTime": "{TIMESTAMP}"
}'}'

URI Parameters

  • System identifier – A unique key identifying the system that NGINX is running on. In our example, this data is defined in the GitHub Actions Variables interface.
  • NGINX instance identifier – A unique key identifying a specific NGINX instance on the system. In our example, this data is defined in the GitHub Actions Variables interface.

Header Parameters

  • Authorization – The authorization method and Base64 encoded credentials that Instance Manager uses to authenticate the API call. In the example, you will use Basic Authorization with credentials data coming from the secrets set in the repository.

JSON Data Parameters

  • configFiles – The Base64 encoded contents of configuration files being updated, along with their locations on the system running NGINX. You will also need to provide a path to the root directory of your NGINX configuration files, most commonly configured as: /etc/nginx.
  • externalIdType – A label that identifies the source of the configuration file to Instance Manager. Possible values are git or other. In our example, we hardcode this parameter to git.
  • externalId – The Git commit Secure Hash Algorithm (SHA) that identifies the change to the configuration files.
  • updateTime – A string containing the current date and time in %Y-%m-%dT%H:%M:%SZ format.

Base64 Encoding

To accommodate Instance Manager’s API specification, you must transform certain data by encoding it into Base64 format. While there isn’t a native way to accomplish this with existing GitHub Actions, we can rely on Linux tools, accessible from our YAML.

Instance Manager Credentials

Start by referencing the Instance Manager login credentials that were defined earlier as secrets and concatenate them. Then, convert the string to Base64, echo it as a Linux variable (NMS_LOGIN) and append the result to a predefined environment variable (GITHUB_ENV), accessible by the Actions runner.

run: echo "NMS_LOGIN=`echo -n "${{ secrets.NMS_USERNAME }}:${{ secrets.NMS_PASSWORD }}" | base64`" >> $GITHUB_ENV

Timestamp

The Instance Manager API requires that a specifically formatted timestamp is sent with certain API payloads. You can construct the timestamp in that format using the Linux date command. Similar to the previous example, append the constructed string as a variable to the Linux environment.

run: echo "NMS_TIMESTAMP=`date -u +"%Y-%m-%dT%H:%M:%SZ"`" >> $GITHUB_ENV

NGINX Configurations

Next, add the NGINX configurations that you plan to manage into the repository. There are many ways of adding files to a GitHub repository. For more information, follow this guide in GitHub’s documentation. To follow our example, you can create a directory structure in your GitHub repository that mirrors that of the instance.

The YAML entry below reads the configuration file from your repository, encodes its contents to Base64 and adds the result to an environment variable, as before.

run: echo "NGINX_CONF_CONFIG_FILE=`cat nginx-server/etc/nginx/nginx.conf | base64 -w 0`" >> $GITHUB_ENV

In our example, we repeat this for every configuration file in our GitHub repository.

Putting It All Together

Finally, you can use GitHub’s sample reference implementation to piece together what you’ve learned into a working YAML file. As defined in the file, all associated GitHub Actions scripts will run whenever a user updates the repository through a commit or pull request. The final entry in the YAML will run a curl command that will make the appropriate API call, containing the necessary data for Instance Manager to update all the related configuration files.

Note: Use the multi-line run entry (run: |) in your YAML to run the curl command because this instructs the YAML interpreter to treat colons “:” as text in the parameter portion of the entry.


name: Managing NGINX configs with GitHub and GitHub Actions 
# Controls when the workflow will run 
on: 
  # Triggers the workflow on push or pull request events but only for the "main" branch 
  push: 
    branches: [ "main" ] 
  pull_request: 
    branches: [ "main" ] 
  
  # Allows you to run this workflow manually from the Actions tab 
  workflow_dispatch: 

# A workflow run is made up of one or more jobs that can run sequentially or in parallel 
jobs: 
  # This workflow contains a single job called "build" 
  build: 
    # The type of runner that the job will run on 
    runs-on: ubuntu-latest 

    # Steps represent a sequence of tasks that will be executed as part of the job 
    steps: 
      # Checks-out your repository under $GITHUB_WORKSPACE, so your job can access it 
      - uses: actions/checkout@v4 

      - name: Set environment variable for NMS API login credentials 
        run: echo "NMS_LOGIN=`echo -n "${{ secrets.NMS_USERNAME }}:${{ secrets.NMS_PASSWORD }}" | base64`" >> $GITHUB_ENV 

      - name: Set environment variable for NMS API timestamp 
        run: echo "NMS_TIMESTAMP=`date -u +"%Y-%m-%dT%H:%M:%SZ"`" >> $GITHUB_ENV 

      - name: Set environment variable for base64 encoded config file 
        run: echo "NGINX_CONF_CONFIG_FILE=`cat app-sfo-01/etc/nginx/nginx.conf | base64 -w 0`" >> $GITHUB_ENV 

      - name: Set environment variable for base64 encoded config file 
        run: echo "MIME_TYPES_CONFIG_FILE=`cat app-sfo-01/etc/nginx/mime.types | base64 -w 0`" >> $GITHUB_ENV 

      - name: Set environment variable for base64 encoded config file 
        run: echo "DEFAULT_CONF_CONFIG_FILE=`cat app-sfo-01/etc/nginx/conf.d/default.conf | base64 -w 0`" >> $GITHUB_ENV 

      - name: Set environment variable for base64 encoded config file 
        run: echo "SSL_CONF_CONFIG_FILE=`cat app-sfo-01/etc/nginx/conf.d/ssl.conf | base64 -w 0`" >> $GITHUB_ENV 

      - name: API call to Instance Manager 
        run: | 
          curl --location 'https://${{ vars.NMS_HOSTNAME }}/api/platform/v1/systems/${{ vars.SYSTEM_ID }}/instances/${{ vars.INSTANCE_ID }}/config' --header "accept: application/json" --header "Authorization: Basic ${{ env.NMS_LOGIN }}" --header 'Content-Type: application/json' --data '{"configFiles": {"rootDir": "/etc/nginx","files": [{"contents": "${{ env.NGINX_CONF_CONFIG_FILE }}","name": "/etc/nginx/nginx.conf"},{"contents": "${{ env.MIME_TYPES_CONFIG_FILE }}","name": "/etc/nginx/mime.types"},{"contents": "${{ env.DEFAULT_CONF_CONFIG_FILE }}","name": "/etc/nginx/conf.d/default.conf"},{"contents": "${{ env.SSL_CONF_CONFIG_FILE }}","name": "/etc/nginx/conf.d/ssl.conf"}]},"externalIdType": "git","externalId": "${{ github.sha }}","updateTime": "${{ env.NMS_TIMESTAMP }}"}' 

NGINX Reference Implementation

Executing a configuration update API call after a file has changed can be achieved in different ways. While GitHub Actions is the most convenient method for those who use GitHub, it will not work for GitLab or standalone Git implementations. To address these use cases, we’ve developed a companion shell script reference implementation that can be triggered from the command line or invoked from custom scripts.

In conclusion, our new extension to the Instance Manager API provides a powerful tool for managing configuration updates, rollbacks, and version histories in a modern, decentralized way. Coupling the extension with a third-party text file and code management platform like GitHub enables additional workflow, CI/CD, collaboration, and issue tracking features through an intuitive web-based user interface.

We’d love to hear your thoughts! Give it a try and let us know what you think in the comments or by joining our NGINX Community Slack channel.

Watch: NGINX Gateway Fabric at KubeCon North America 2023

This year at KubeCon North America 2023, we were thrilled to share the first version of NGINX Gateway Fabric. Amidst the sea of exciting new tech, the conference served as the ideal stage for unveiling our implementation of the Kubernetes Gateway API.

Booth attendees were excited to learn about our unified app delivery fabric approach to managing app and API connectivity in Kubernetes. NGINX Gateway Fabric is a conformant implementation of Kubernetes Gateway API specifications that provides fast, reliable, and secure Kubernetes app and API connectivity leveraging one of the most widely used data planes in the world – NGINX.

As always, F5 DevCentral was there covering the action. Here is the moment we got into talking about NGINX Gateway Fabric:

Another hot topic at KubeCon this year was multi-cluster configuration. As organizations adopt distributed architectures like Kubernetes, multi-cluster plays a crucial role for scalability and availability. One of the options to achieve multi-cluster setup is adding NGINX Plus in front of your Kubernetes clusters. Leveraging the cloud native, easy-to-use features of NGINX Plus, including its reverse proxy, load balancing, and API gateway capabilities, users can enhance performance, availability, and security of their multi-cluster Kubernetes environment. Stay tuned for more info on this topic soon!

How to Try NGINX Gateway Fabric

If you’d like to get started with our new Kubernetes implementation, visit the NGINX Gateway Fabric project on GitHub to get involved:

  • Try the implementation in your lab
  • Test and provide feedback
  • Join the project as a contributor

Announcing NGINX Gateway Fabric Version 1.0

Today, we reached a significant milestone and are very excited to announce the first major release of NGINX Gateway Fabric – version 1.0!

NGINX Gateway Fabric provides fast, reliable, and secure Kubernetes app connectivity leveraging Gateway API specifications and one of the most widely used data planes in the world, NGINX.

With NGINX Gateway Fabric, we’ve created a new tool category for Kubernetes – a unified application delivery fabric that is designed to streamline and simplify app, service, and API connectivity in Kubernetes, reducing complexity, improving availability, and providing security and visibility at scale.

NGINX Gateway Fabric, a part of Connectivity Stack for Kubernetes, is our conformant implementation of the Gateway API that is built on the proven NGINX data plane. The Gateway API is a cross-vendor, open source project intended to standardize and improve app and service networking in Kubernetes, and NGINX is an active participant of this project.

The Gateway API evolved from the Kubernetes Ingress API to address the limitations of using Ingress objects in production, including complexity and error proneness when configuring advanced use cases and supporting multi-tenant teams in the same infrastructure. In addition, the Gateway API formed the Gateway API for Mesh Management and Administration (GAMMA) subgroup to research and define capabilities and resources of the Gateway API specifications for service mesh use cases.

At NGINX, we see the long-term future of unified app and API connectivity to, from, and within a Kubernetes cluster in the Gateway API, and NGINX Gateway Fabric is the reflection of our vision. It is architected to enable both north-south and east-west Kubernetes app and service connectivity use cases, effectively combining Ingress controller and service mesh capabilities in one unified tool that leverages the same control and data planes with centralized management across any Kubernetes environment.

With version 1.0, we are focusing on advanced connectivity use cases at the edge of a Kubernetes cluster, such as blue-green deployments, TLS termination, and SNI routing. In the future roadmap, there are plans to expand these capabilities with more security and observability features, including addressing service-to-service communications use cases.

What Is NGINX Gateway Fabric?

NGINX Gateway Fabric is architected to deliver future-proof connectivity for apps and services to, from, and within a Kubernetes cluster with its built-in support for advanced use cases, role-based API model, and extensibility that unlocks the true power of NGINX.

NGINX Gateway Fabric standardizes on three primary Gateway API resources (GatewayClass, Gateway, and Routes) with role‑based access control (RBAC) mapping to the associated roles (infrastructure providers, cluster operators, and application developers).

Clearly defining the scope of responsibility and separation for different roles streamlines and simplifies administration. Specifically, infrastructure providers define GatewayClasses for Kubernetes clusters while cluster operators deploy and configure Gateways within a cluster, including policies. Application developers are then free to attach Routes to Gateways to expose their applications externally while sharing the same underlying infrastructure. When clients connect to their apps, NGINX Gateway Fabric routes these requests to the respective application.

To learn more on how NGINX Gateway Fabric processes the complex routing rules, read our blog How NGINX Gateway Fabric Implements Complex Routing Rules.

NGINX Gateway Fabric Benefits

NGINX Gateway Fabric helps increase uptime and reduce complexity of your Kubernetes environment from edge to cloud. It is designed to simplify operations, unlock advanced capabilities, and provide seamless interoperability for Kubernetes environments, delivering improved, future-proof Kubernetes app and service connectivity.

Benefits of NGINX Gateway Fabric include:

  • Data plane – Built on one of the world’s most popular data planes, NGINX Gateway Fabric provides fast, reliable, and secure connectivity for Kubernetes apps. It simplifies and streamlines Kubernetes platform deployment and management by leveraging the same data and control planes across any hybrid, multi-cloud Kubernetes environment, reducing complexity and tool sprawl.
  • Extensibility – Unlike Kubernetes Ingress resources, many advanced use cases are available “out of the box” with NGINX Gateway Fabric, including blue-green and canary deployments, A/B testing, and request/response manipulation. It also defines an annotation-less extensibility model with extension points and policy attachments to unlock advanced NGINX data plane features that are not supported by the API itself.
  • Interoperability – NGINX Gateway Fabric is a dedicated and conformant implementation of the Gateway API, which provides high-level configuration compatibility and portability for easier migration across different implementations. Its Kubernetes-native design ensures seamless ecosystem integration with other Kubernetes platform tools and processes like Prometheus and Grafana.
  • Governance – NGINX Gateway Fabric features a native role-based API model that enables self-service governance capabilities to share the infrastructure across multi-tenant teams. As an open source project, it operates compliant with established community governance procedures, delivering full transparency in its development process, features roadmap, and contributions.
  • Conformance – NGINX Gateway Fabric is tested and validated to conform with the Gateway API specifications in accordance with standardized conformance tests, ensuring a consistent experience with API operations.

NGINX Gateway Fabric Architecture

Rather than shoehorn Gateway API capabilities into NGINX Ingress Controller, we created NGINX Gateway Fabric as an entirely separate project to implement the Kubernetes Gateway API. If you are curious about the reasoning behind that, read our blog Why We Decided to Start Fresh with Our NGINX Gateway Fabric.

An NGINX Gateway Fabric pod consists of two containers:

  • nginx container – Provides the data plane and consists of an NGINX master process and NGINX worker processes. The master process controls the worker processes, which handle the client traffic and load balance the traffic to the backend applications.
  • nginx-gateway container – Provides the control plane, watches Kubernetes objects (Services, Endpoints, Secrets, and Gateway API CRDs), and configures NGINX.

For the detailed description of NGINX Gateway Fabric’s design, architecture, and component interactions, refer to the project documentation.

Getting Started with NGINX Gateway Fabric

If you are interested in NGINX’s implementation of the Gateway API, check out the NGINX Gateway Fabric project on GitHub. You can get involved by:

  • Joining the project as a contributor
  • Trying the implementation in your lab
  • Testing and providing feedback

To learn more about how you can enhance application delivery with NGINX Kubernetes solutions, visit the Connectivity Stack for Kubernetes web page.

Are you still thinking about why you should try the Gateway API? Read our blog 5 Reasons to Try the Kubernetes Gateway API to get the answer.

Also, don’t miss the chance to visit the NGINX booth at KubeCon North America 2023 to chat with the developers of NGINX Gateway Fabric. NGINX, part of F5, is proud to be a Platinum sponsor of KubeCon NA 2023, and we hope to see you there!

Which NGINX Ingress Controllers Are Impacted by CVE-2022-4886, CVE-2023-5043, and CVE-2023-5044?

On October 25, 2023, three CVEs were reported by the National Institute of Standards and Technology (NIST) that affected NGINX Ingress Controller for Kubernetes:

  • CVE-2022-4886 – ingress-nginx path sanitization can be bypassed with log_format directive.
  • CVE-2023-5043 – ingress-nginx annotation injection causes arbitrary command execution.
  • CVE-2023-5044 – Code injection occurs via nginx.ingress.kubernetes.io/permanent-redirect annotation.

That report and subsequent publications (such as Urgent: New Security Flaws Discovered in NGINX Ingress Controller for Kubernetes) caused some confusion (and a number of support inquiries) pertaining to which NGINX Ingress controllers are actually affected and who should be concerned about addressing vulnerabilities described by these CVEs.

The confusion is totally understandable – did you know that there is more than one Ingress controller based on NGINX? To start, there are two completely different projects named “NGINX Ingress Controller”:

  • Community project – Found in the kubernetes/ingress-nginx repo on GitHub, this Ingress controller is based on the NGINX Open Source data plane but developed and maintained by the Kubernetes community, with docs hosted on GitHub.
  • NGINX project – Found in the nginxinc/kubernetes-ingress repo on GitHub, NGINX Ingress Controller is developed and maintained by F5 NGINX with docs on docs.nginx.com. This official NGINX project is available in two editions:
    • NGINX Open Source‑based (free and open source option)
    • NGINX Plus-based (commercial option)

There are also other Ingress controllers based on NGINX, such as Kong. Fortunately, their names are easily distinguished. If you’re not sure which one you’re using, check the container image of the running Ingress controller, then compare the Docker image name with the repos listed above.

The vulnerabilities (CVE-2022-4886, CVE-2023-5043, and CVE-2023-5044) described above only apply to the community project (kubernetes/ingress-nginx). NGINX projects for NGINX Ingress Controller (nginxinc/kubernetes-ingress, both open source and commercial) are not affected by these CVEs.

For more information about the differences between NGINX Ingress Controller and Ingress controller projects, read our blog A Guide to Choosing an Ingress Controller, Part 4: NGINX Ingress Controller Options.