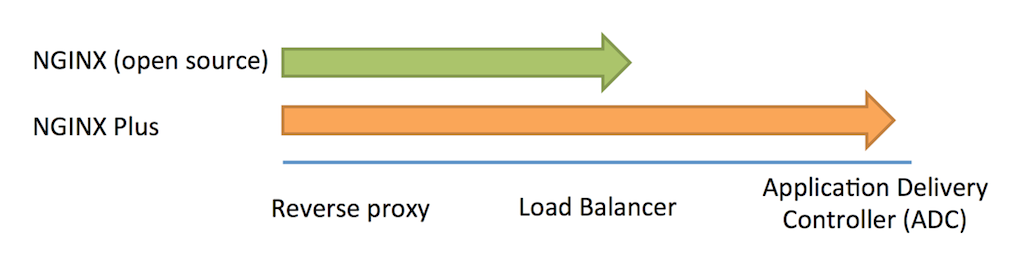
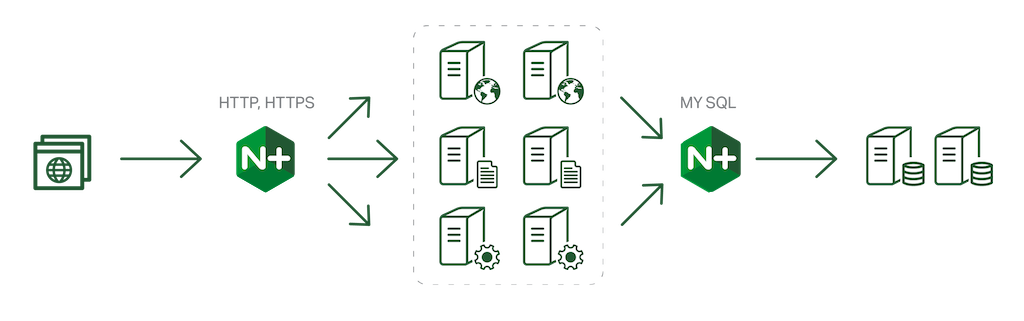
It’s no secret that in today’s always‑on, always‑connected society, users expect your sites and apps to be accessible 24×7. This is where NGINX and NGINX Plus have always helped you shine. One of the key benefits of deploying NGINX Plus as a reverse proxy and load balancer for your application servers is increased application availability and reliability, and you can improve app and website performance even further by adding high availability (HA) to NGINX Plus itself.
In NGINX Plus Release 6 (R6), we’ve introduced a new solution that makes it fast and easy to deploy NGINX Plus instances in an active‑passive HA configuration. The solution is based on the open source keepalived project, which combines three components to provide an HA solution for Linux systems: the keepalived daemon, an implementation of the Virtual Router Redundancy Protocol (VRRP) that manages assignment of the virtual IP address for the HA pair, and a health‑checking facility that determines whether a service (for example, a web server, PHP backend, or NGINX Plus) is up and operational.
Editor –
- For an overview of all the new features in NGINX Plus R6, see Announcing NGINX Plus R6 with Enhanced Load Balancing, High Availability, and Monitoring Features on our blog.
- For detailed discussions of other new features in NGINX Plus R6, see these related blog posts:
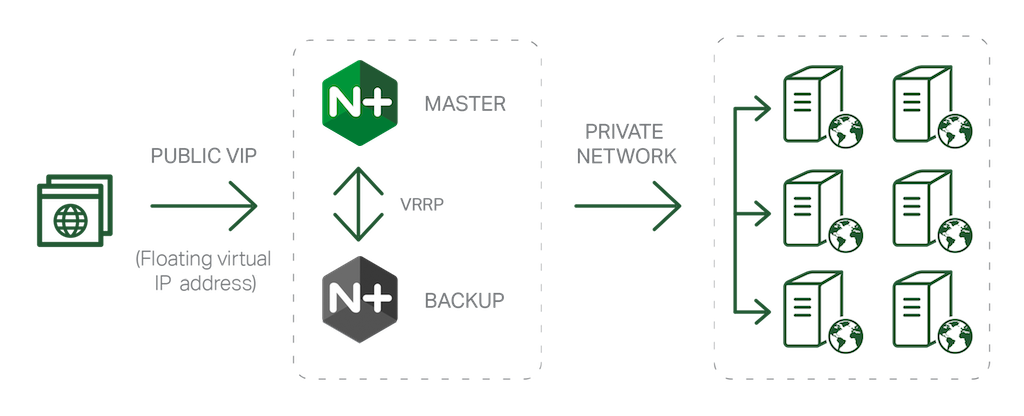
How Does High Availability Work?
Based on an initial configuration (see Configuring NGINX Plus for HA below), keepalived designates one NGINX Plus node as the (active) primary node and the other as the (passive) backup. Each node has its own IP address, and the primary node is also assigned a virtual IP address, which is the one advertised to clients in the Domain Name System (DNS). During operation, VRRP and the health‑checking facility monitor the operation of the nodes and NGINX Plus so that the virtual IP address can be reassigned to the backup if the primary fails:
- The VRRP instance on the backup node listens for advertisement packets from its peer on the primary node. If it does not receive an advertisement packet for a period longer than three times the configured advertisement interval, it takes over as primary and assigns the virtual IP address to itself.
- If health checks of NGINX Plus on the primary node fail a configured number of times,
keepalivedreassigns the virtual IP address from the primary node to the backup node.
Configuring NGINX Plus for HA
To configure an active‑passive pair of NGINX Plus nodes for HA, perform the following steps on both nodes:
- Install or upgrade to the NGINX Plus R6 base package (nginx-plus) by following the instructions for your operating system at the NGINX Plus repository.
-
Using the installation command specified at the NGINX Plus repository for your operating system, install the nginx-ha-keepalived package by replacing nginx-plus with nginx-ha-keepalived, as in this example for Ubuntu:
root# apt-get install nginx-ha-keepalived -
Collect the following information to supply when prompted by the nginx-ha-setup script that you’ll run in the next step:
- The physical IP addresses of both nodes.
- The virtual IP address, which is assigned initially to the primary node. The script refers to it as the “cluster IP address (or endpoint)”. It must not be the actual IP address of either node.
-
Run the nginx-ha-setup script (it’s installed from the nginx-ha-keepalived package into /usr/bin).
root# nginx-ha-setupWe recommend that you run the script on both nodes at the same time in side‑by‑side terminal windows, performing each step on both nodes before proceeding to the next step. We also recommend that you use the Linux
screen(1) command to start the terminal windows, so that installation can continue if a session gets disconnected.
The keepalived Configuration Script
On each node, the nginx-ha-setup script creates the local keepalived configuration file, /etc/keepalived/keepalived.conf, incorporating the values you provided in Step 3 above. The following is an example created on a node with IP address 192.168.100.100 (the other node’s address is 192.168.100.101 and the virtual IP address is 192.168.100.150). Note that although this looks a lot like NGINX Plus configuration, it isn’t – for one thing, semicolons are not used to delimit directives.
vrrp_script chk_nginx_service {
    script "/usr/libexec/keepalived/nginx-ha-check"
    interval 3
    weight 50
}

vrrp_instance VI_1 {
    interface eth0
    state BACKUP
    priority 101
    virtual_router_id 51
    advert_int 1
    unicast_src_ip 192.168.100.100
    unicast_peer {
        192.168.100.101
    }
    authentication {
        auth_type PASS
        auth_pass f8f0e5114cbe031a3e1e622daf18f82a
    }
    virtual_ipaddress {
        192.168.100.150
    }
    track_script {
        chk_nginx_service
    }
    notify "/usr/libexec/keepalived/nginx-ha-notify"
}
Explaining the purpose of every directive is beyond the scope of this post, but there are a few things to note.
- There are two main configuration blocks in the file:
-
The
vrrp_scriptblock configures the health‑checking facility to run a script that checks whether NGINX Plus is operational.The nginx-ha-check script is installed automatically from the nginx-ha-keepalived package into the indicated directory, which varies by operating system.
The
intervaldirective sets how often the script runs, in seconds. -
The
vrrp_instanceblock configures the VRRP instance on this node.The IP addresses you provide are recorded as the values of three directives:
unicast_src_ip(the local node),unicast_peer(the other node), andvirtual_ipaddress(the virtual IP address assigned to the primary node).The
advert_intdirective controls how often (in seconds) the VRRP instance on the primary node sends advertisements to its peer on the backup node.The value
51for thevirtual_router_iddirective is a sample value; change it as necessary to be unique in your environment (this becomes relevant if you are using VRRP to provide HA for multiple services).
-
- Together, the
weightdirective in thevrrp_scriptblock and theprioritydirective in thevrrp_instanceblock are used in determining which node becomes primary. For more information, see Using a Health‑Checking Script to Control Which Node Is Primary in the NGINX Plus Admin Guide article. -
If you have multiple pairs of
keepalivedinstances (or other VRRP instances) running in your local network, create avrrp_instanceblock for each one, with a unique name (likeVI_1in the example) andvirtual_router_idnumber.Similarly, if you are using
keepalivedto provide HA for other services, for each one you need to create a separate health‑check script andvrrp_scriptblock.
Related Reading
For more details about the HA solution, see the NGINX Plus Admin Guide. It explains how to find out which node is primary, force a role change, manually reassign the virtual IP address, troubleshoot keepalived and VRRP, and add more virtual IP addresses. It also points you to sample configuration files for more complex HA setups.
For an overview of all the new features in NGINX Plus R6, see Announcing NGINX Plus Release 6 with Enhanced Load Balancing, High Availability, and Monitoring Features on our blog.
For detailed discussions of other new features in NGINX Plus R6, see these related blog posts:
- TCP Load Balancing with NGINX 1.9.0 and NGINX Plus R6
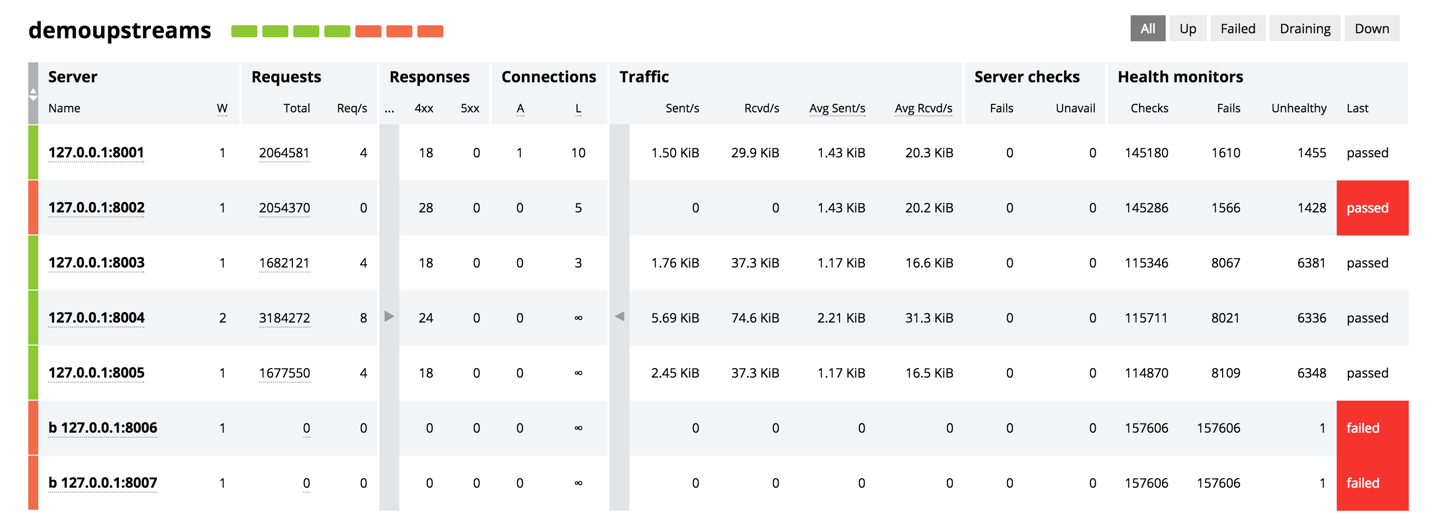
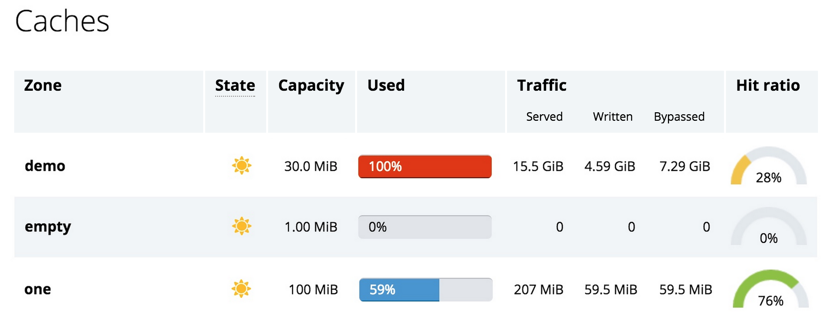
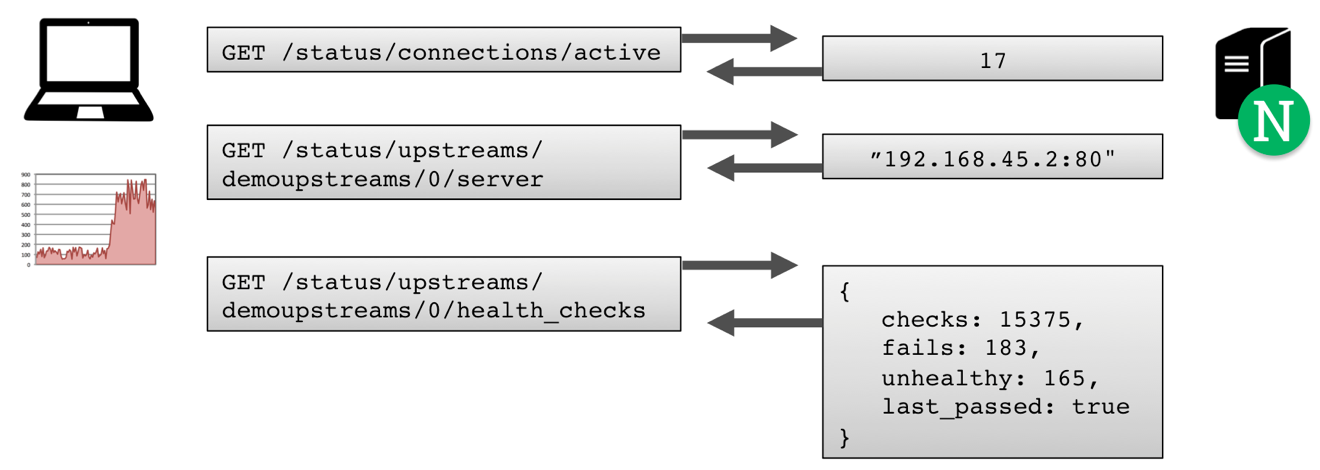
- Keeping Tabs on System Health with NGINX Plus Live Activity Monitoring
To try out the HA solution for yourself, start your free 30-day trial today or contact us to discuss your use cases.

 In the report, Gartner notes that “Digital business leaders with extreme scalability requirements…have found traditional application infrastructures inadequate to support their needs – as a result, they have invented new design patterns and techniques to support massive scale.”