
If you’re looking for a tool to trace web applications and infrastructure more effectively, OpenTelemetry might be just what you need. By instrumenting your NGINX server with the existing OpenTelemetry NGINX community module you can collect metrics, traces, and logs and gain better visibility into the health of your server. This, in turn, enables you to troubleshoot issues and optimize your web applications for better performance. However, this existing community module can also slow down your server’s response times due to the performance overhead it requires for tracing. This process can also consume additional resources, increasing CPU and memory usage. Furthermore, setting up and configuring the module can be a hassle.
NGINX has recently developed a native OpenTelemetry module, ngx_otel_module, which revolutionizes the tracing of request processing performance. The module utilizes telemetry calls to monitor application requests and responses, enabling enhanced tracking capabilities. The module can be conveniently set up and configured within the NGINX configuration files, making it highly user-friendly. This new module caters to the needs of both NGINX OSS and NGINX Plus users. It supports W3C context propagation and OTLP/gRPC export protocol, rendering it a comprehensive solution for optimizing performance.
The NGINX-native OpenTelemetry module is a dynamic module that doesn’t require any additional packaging with NGINX Plus. It offers a range of features, including the API and key-value store modules. These features work together to provide a complete solution for monitoring and optimizing the performance of your NGINX Plus instance. By using ngx_otel_module, you can gain valuable insights into your web application’s performance and take steps to improve it. We highly recommend exploring ngx_otel_module to discover how it can help you achieve better results.
Note: You can head over to our GitHub page for detailed instructions on how to install nginx_otel_module and get started.
Tutorial Overview
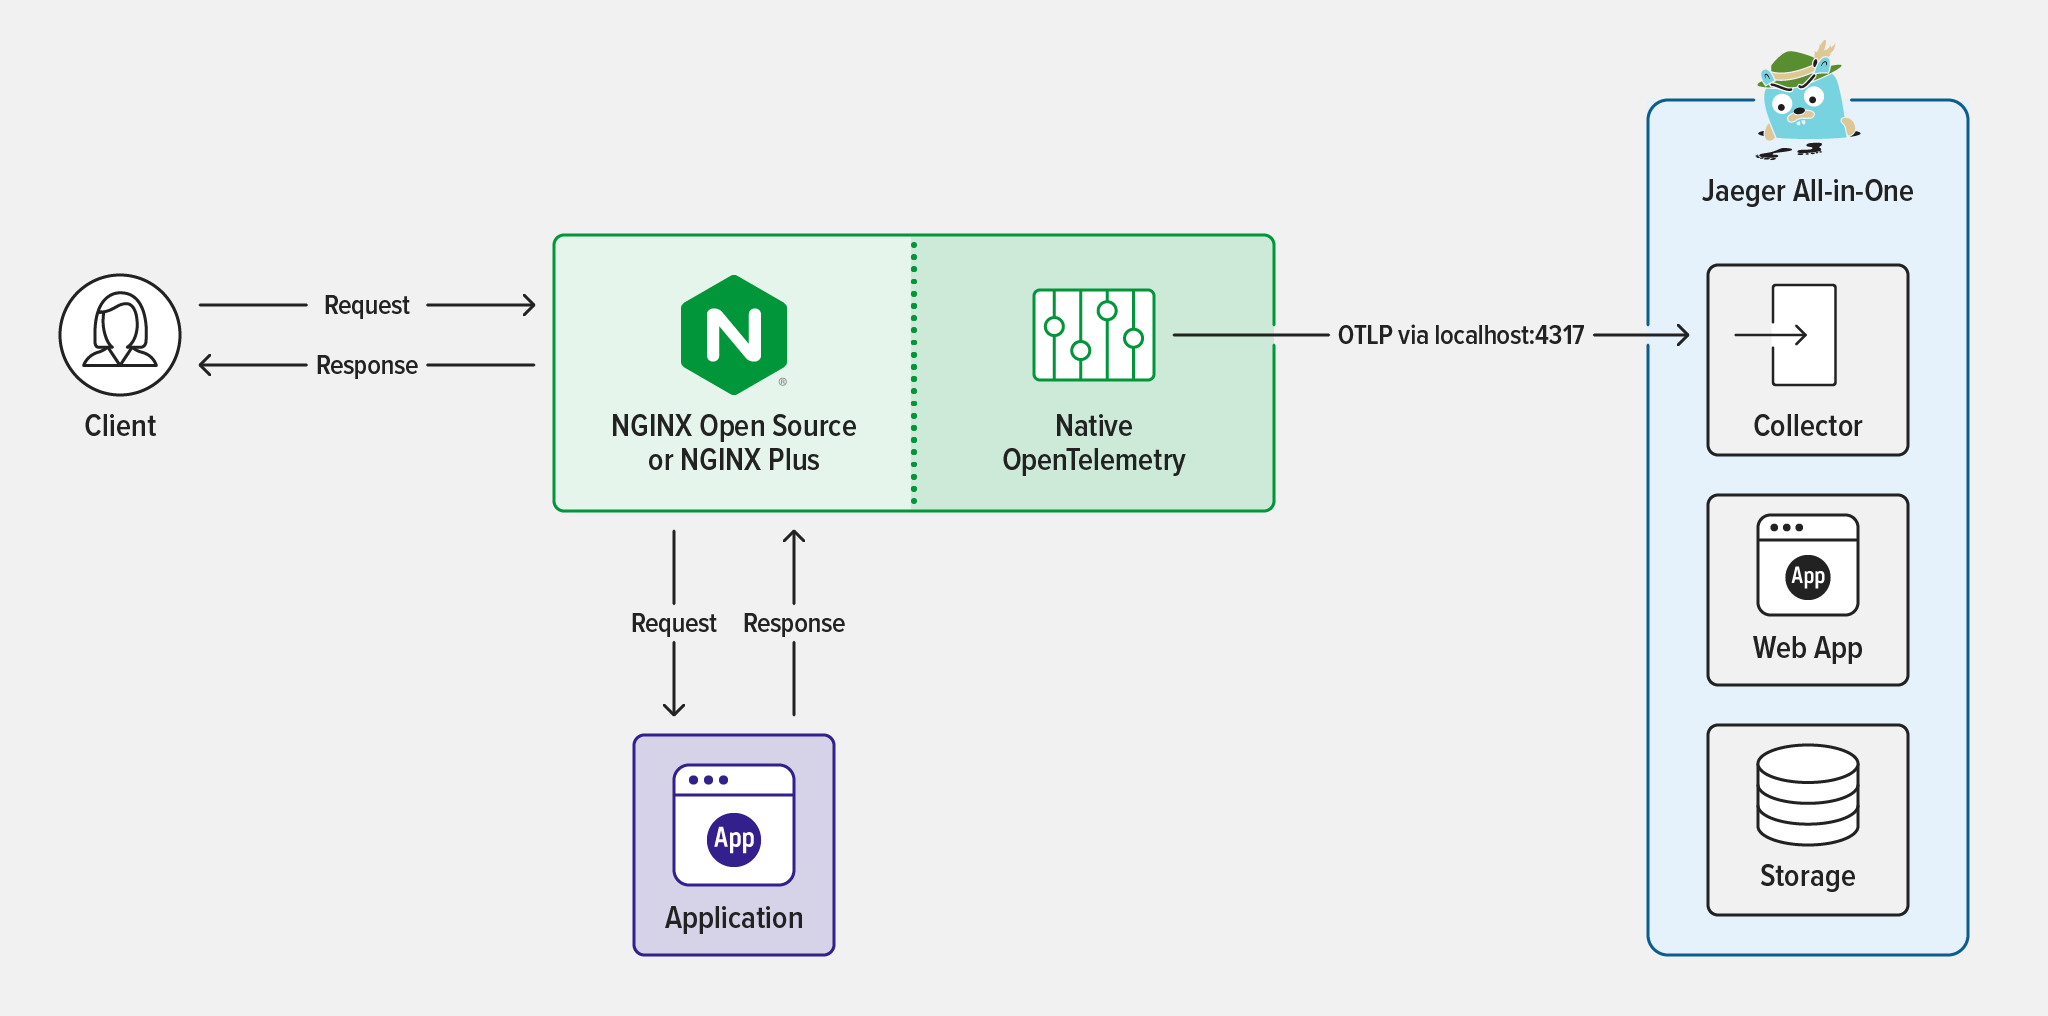
In this blog, you can follow a step-by-step guide on configuring OpenTelemetry in NGINX Plus and using the Jaeger tool to collect and visualize traces. OpenTelemetry is a powerful tool that offers a comprehensive view of a request’s path, including valuable information such as latency, request details, and response data. This can be incredibly useful in optimizing performance and identifying potential issues. To simplify things, we have set up the OpenTelemetry module, application, and Jaeger all in one instance, which you can see in the diagram below.
Follow the steps in these sections to complete the tutorial:
- Prerequisites
- Deploy NGINX Plus and Install the OpenTelemetry Module
- Deploy Jaeger and the
echoApplication - Configure OpenTelemetry in NGINX for Tracing
- Test the Configuration
Prerequisites
- A Linux/Unix environment, or any compatible environment
- A NGINX Plus subscription
- Basic familiarity with the Linux command line and JavaScript
- Docker
- Node.js 19.x or later
- Curl
Deploy NGINX Plus and Install the OpenTelemetry Module
Selecting an appropriate environment is crucial for successfully deploying an NGINX instance. This tutorial will walk you through deploying NGINX Plus and installing the NGINX dynamic modules.
- Install NGINX Plus on a supported operating system.
- Install
ngx_otel_module. Add the dynamic module to the NGINX configuration directory to activate OpenTelemetry: - Reload NGINX to enable the module:
load_module modules/ngx_otel_module.so;
nginx -t && nginx -s reload
Deploy Jaeger and the echo Application
There are various options available to view traces. This tutorial uses Jaeger to collect and analyze OpenTelemetry data. Jaeger provides an efficient and user-friendly interface to collect and visualize tracing data. After data collection, you will deploy mendhak/http-https-echo, a simple Docker application. This application returns the request attributes for JavaScript in JSON format.
- Use
docker-composeto deploy Jaeger and thehttp-echoapplication. You can create adocker-composefile by copying the configuration below and saving it in a directory of your choice.version: '3' Services: jaeger: image: jaegertracing/all-in-one:1.41 container_name: jaeger ports: - "16686:16686" - "4317:4317" - "4318:4318" environment: COLLECTOR_OTLP_ENABLED: true http-echo: image: mendhak/http-https-echo environment: - HTTP_PORT=8888 - HTTPS_PORT=9999 ports: - "4500:8888" - "8443:9999" - To install the Jaeger all-in-one tracing and
http-echoapplication. Run this command: - Run the docker
ps -acommand to verify if the container is installed.
'docker-compose up -d'
$docker ps -a
CONTAINER ID   IMAGE                           COMMAND                  CREATED        STATUS
PORTS                                                                                                                                                                   NAMES

5cb7763439f8   jaegertracing/all-in-one:1.41   "/go/bin/all-in-one-…"   30 hours ago   Up 30 hours   5775/udp, 5778/tcp, 14250/tcp, 0.0.0.0:4317-4318->4317-4318/tcp, :::4317-4318->4317-4318/tcp, 0.0.0.0:16686->16686/tcp, :::16686->16686/tcp, 6831-6832/udp, 14268/tcp   jaeger

e55d9c00a158   mendhak/http-https-echo         "docker-entrypoint.s…"   11 days ago    Up 30 hours   8080/tcp, 8443/tcp, 0.0.0.0:8080->8888/tcp, :::8080->8888/tcp, 0.0.0.0:8443->9999/tcp, :::8443->9999/tcp                                                                ubuntu-http-echo-1
You can now access Jaeger by simply typing in the http://localhost:16686 endpoint in your browser. Note that you might not be able to see any system trace data right away as it is currently being sent to the console. But don’t worry! We can quickly resolve this by exporting the traces in the OpenTelemetry Protocol (OTLP) format. You’ll learn to do this in the next section when we configure NGINX to send the traces to Jaeger.
Configure OpenTelemetry in NGINX for Tracing
This section will show you step-by-step how to set up the OpenTelemetry directive in NGINX Plus using a key-value store. This powerful configuration enables precise monitoring and analysis of traffic, allowing you to optimize your application’s performance. By the end of this section, you will have a solid understanding of utilizing the NGINX OpenTelemetry module to track your application’s performance.
Setting up and configuring telemetry collection is a breeze with NGINX configuration files. With ngx_otel_module, users can access a robust, protocol-aware tracing tool that can help to quickly identify and resolve issues in applications. This module is a valuable addition to your application development and management toolset and will help you enhance the performance of your applications. To learn more about configuring other OpenTelemetry sample configurations, please refer to the documentation ngx_otel_module documentation.
OpenTelemetry Directives and Variables
NGINX has new directives that can help you achieve an even more optimized OpenTelemetry deployment, tailored to your specific needs. These directives were designed to enhance your application’s performance and make it more efficient than ever.
Module Directives:
otel_exporter– Sets the parameters for OpenTelemetry data, including theendpoint,interval,batch size, andbatch count. These parameters are crucial for the successful export of data and must be defined accurately.otel_service_name– Sets the service name attribute for your OpenTelemetry resource to improve organization and tracking.otel_trace– To enable or disable OpenTelemetry tracing, you can now do so by specifying a variable. This offers flexibility in managing your tracing settings.otel_span_name– The name of the OpenTelemetry span is set as the location name for a request by default. It’s worth noting that the name is customizable and can include variables as required.
Configuration Examples
Here are examples of ways you can configure OpenTelemetry in NGINX using the NGINX Plus key-value store. The NGINX Plus key-value store module offers a valuable use case that enables dynamic configuration of OpenTelemetry span and other OpenTelemetry attributes, thereby streamlining the process of tracing and debugging.
This is an example of dynamically enabling OpenTelemetry tracing by using a key-value store:
http {
      keyval "otel.trace" $trace_switch zone=name;

      server {
          location / {
              otel_trace $trace_switch;
              otel_trace_context inject;
              proxy_pass http://backend;
          }

          location /api {
              api write=on;
          }
      }
  }
Next, here’s an example of dynamically disabling OpenTelemetry tracing by using a key-value store:
location /api {
              api write=off;
          }
Here is an example NGINX OpenTelemetry span attribute configuration:
user  nginx;
worker_processes  auto;
load_module modules/ngx_otel_module.so;
error_log /var/log/nginx debug;
pid   /var/run/nginx.pid;


events {
    worker_connections  1024;
}

http {
    keyval "otel.span.attr" $trace_attr zone=demo;
    keyval_zone zone=demo:64k  state=/var/lib/nginx/state/demo.keyval;

    log_format  main  '$remote_addr - $remote_user [$time_local] "$request" '
                      '$status $body_bytes_sent "$http_referer" '
                      '"$http_user_agent" "$http_x_forwarded_for"';
    include       mime.types;
    default_type  application/json;
    upstream echo {
        server localhost:4500;
        zone echo 64k;
    }
    otel_service_name nginx;
    otel_exporter {
           endpoint localhost:4317;
        }

    server {
       listen       4000;
       otel_trace on;
       otel_span_name otel;
       location /city {
            proxy_set_header   "Connection" "" ;
            proxy_set_header Host $host;
            otel_span_attr demo $trace_attr;
            otel_trace_context inject;
            proxy_pass http://echo;
       }
       location /api {
           api write=on;
       }
       location = /dashboard.html {
        root /usr/share/nginx/html;
    }

  }

}
To save the configuration and restart NGINX, input this code:
nginx -s reload
Lastly, here is how to add span attribute in NGINX Plus API:
curl -X POST -d '{"otel.span.attr": "<span attribute name>"}' http://localhost:4000/api/6/http/keyvals/<zone name>
Test the Configuration
Now, you can test your configuration by following the steps below.
-
To generate the trace data, start by opening your terminal window. Next, type in this command to create the data:
$ curl -i localhost:4000/cityThe output will look like this:
HTTP/1.1 200 OK Server: nginx/1.25.3 Date: Wed, 29 Nov 2023 20:25:04 GMT Content-Type: application/json; charset=utf-8 Content-Length: 483 Connection: keep-alive X-Powered-By: Express ETag: W/"1e3-2FytbGLEVpb4LkS9Xt+KkoKVW2I" { "path": "/city", "headers": { "host": "localhost", "connection": "close", "user-agent": "curl/7.81.0", "accept": "*/*", "traceparent": "00-66ddaa021b1e36b938b0a05fc31cab4a-182d5a6805fef596-00" }, "method": "GET", "body": "", "fresh": false, "hostname": "localhost", "ip": "::ffff:172.18.0.1", "ips": [], "protocol": "http", "query": {}, "subdomains": [], "xhr": false, "os": { "hostname": "e55d9c00a158" }, "connection": {} - Now you want to ensure that the OTLP exporter is functioning correctly and that you can gain access to the trace. Start by opening a browser and accessing the Jaeger UI at
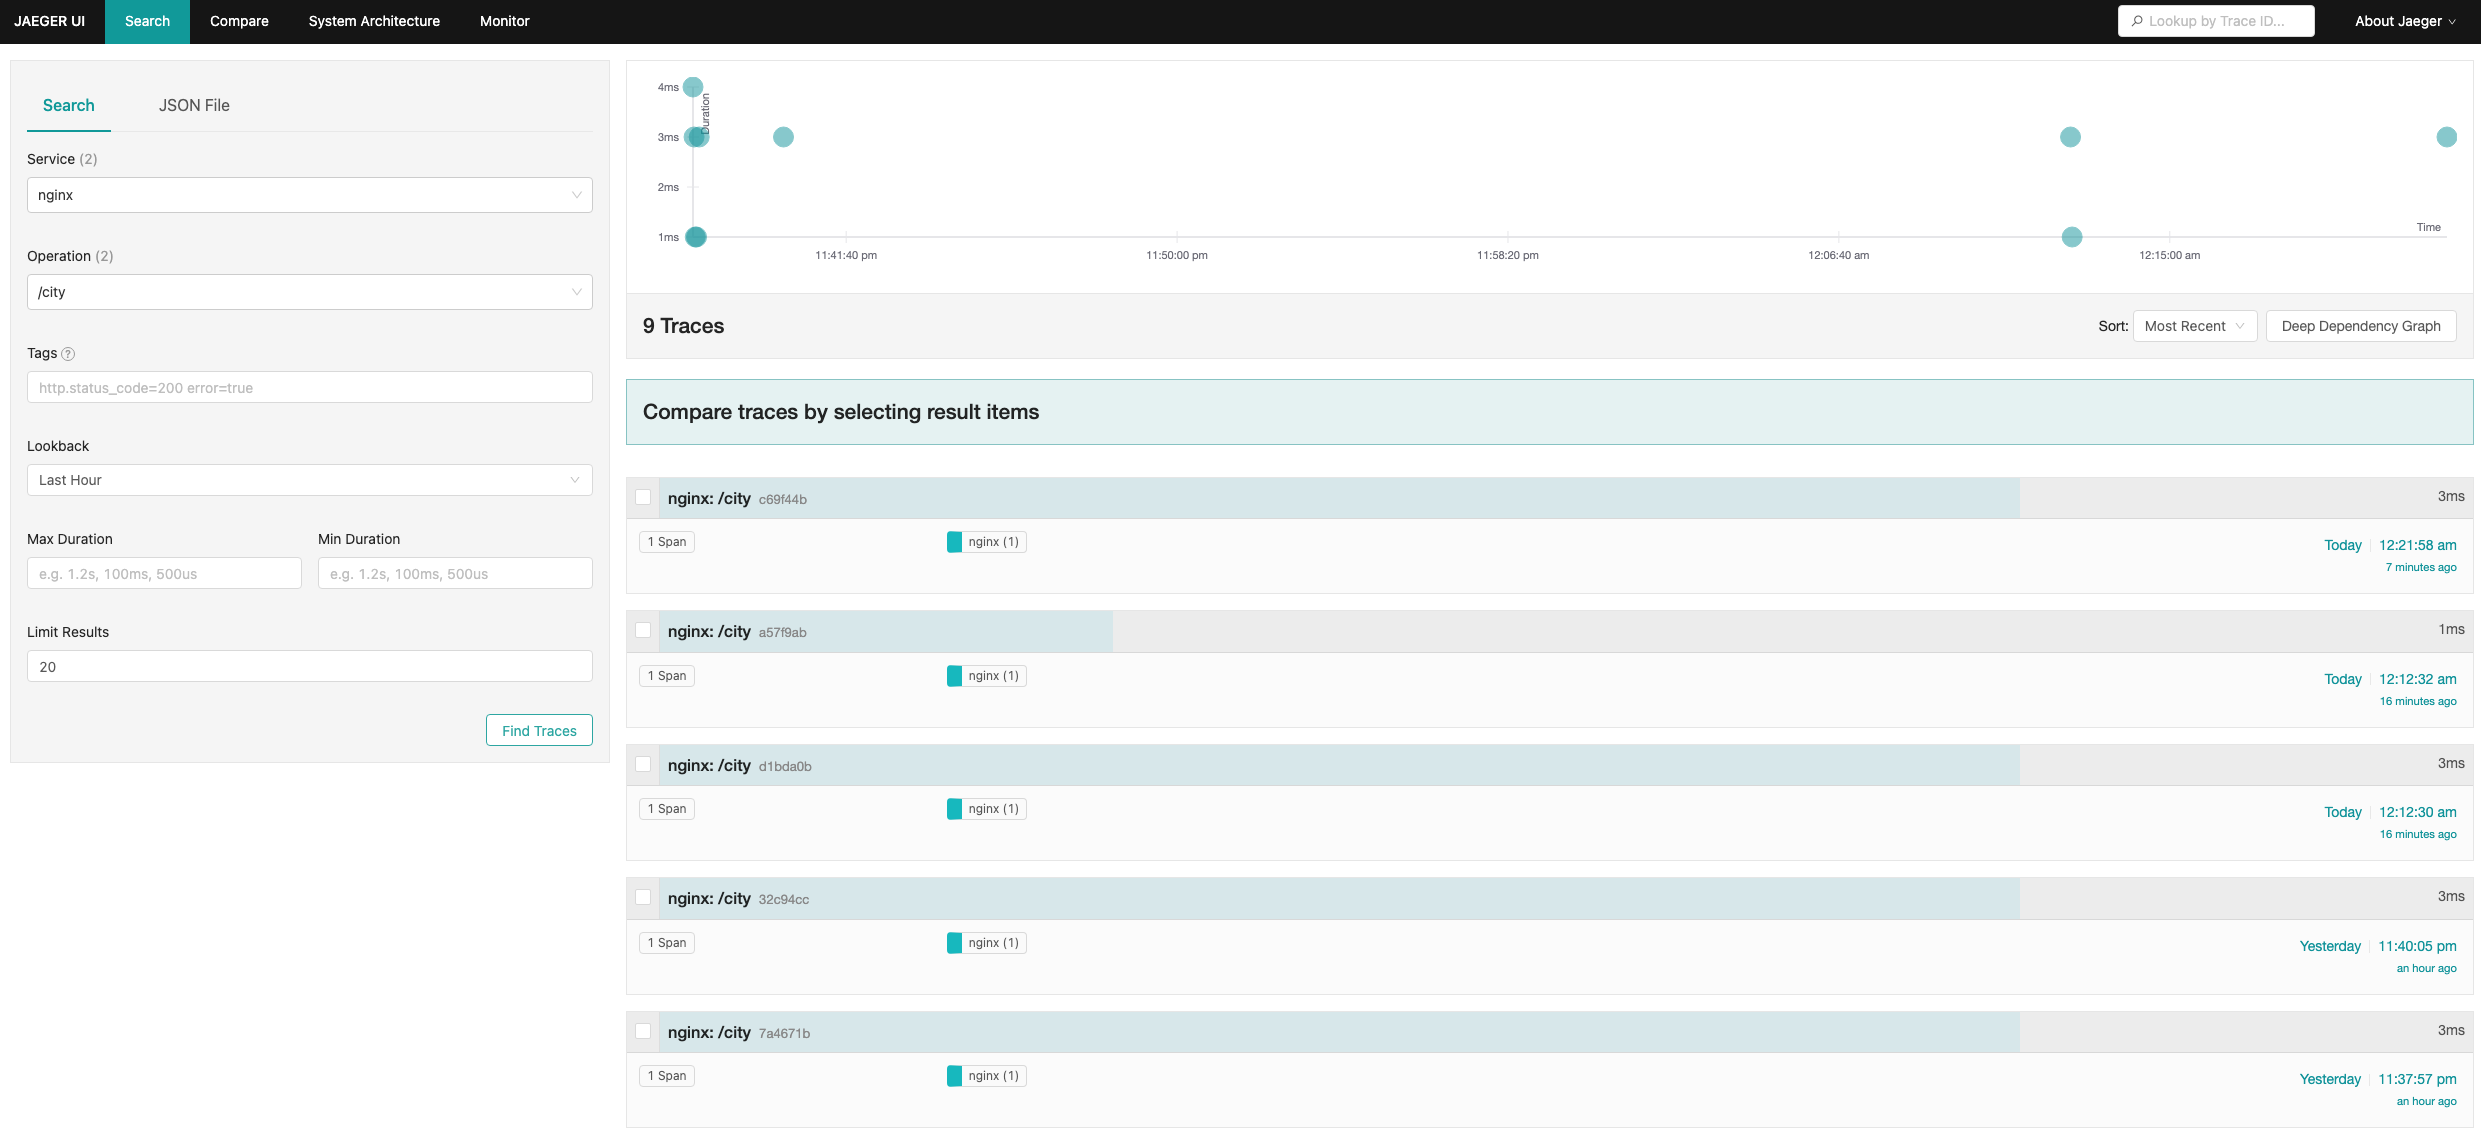
http://localhost:16686. Once the page loads, click on the Search button, located in the title bar. From there, select the service that starts with NGINX from the drop-down menu in the Service field. Then select the operation named Otel from the drop-down menu called Operation. To make it easier to identify any issues, click on the Find Traces button to visualize the trace. - To access a more detailed and comprehensive analysis of a specific trace, click on one of the individual traces available. This will provide you with valuable insights into the trace you have selected. In the trace below, you can review both the OpenTelemetry directive span attribute and the non-directive of the trace, allowing you to better understand the data at hand.
demo – OTel– OpenTelemetry span attribute namehttp.status_code field – 200– Indicates successful creationotel.library.name – nginx– OpenTelemetry service name

Under Tags you can see the following attributes:
Conclusion
NGINX now has built-in support for OpenTelemetry, a significant development for tracing requests and responses in complex application environments. This feature streamlines the process and ensures seamless integration, making it much easier for developers to monitor and optimize their applications.
Although the OpenTracing module that was introduced in NGINX Plus R18 is now deprecated and will be removed starting from NGINX Plus R34, it will still be available in all NGINX Plus releases until then. However, it’s recommended to use the OpenTelemetry module, which was introduced in NGINX Plus R29.
If you’re new to NGINX Plus, you can start your 30-day free trial today or contact us to discuss your use cases.