We released version 3.0 of NGINX Ingress Controller in January 2023 with a host of significant new features and enhanced functionality. One new feature we believe you’ll find particularly valuable is Deep Service Insight, available with the NGINX Plus edition of NGINX Ingress Controller.
Deep Service Insight addresses a limitation that hinders optimal functioning when a routing decision system such as a load balancer sits in front of one or more Kubernetes clusters – namely, that the system has no access to information about the health of individual services running in the clusters behind the Ingress controller. This prevents it from routing traffic only to clusters with healthy services, which potentially exposes your users to outages and errors like 404 and 500.
Deep Service Insight eliminates that problem by exposing the health status of backend service pods (as collected by NGINX Ingress Controller) at a dedicated endpoint where your systems can access and use it for better routing decisions.
In this post we take an in‑depth look at the problem solved by Deep Service Insight, explain how it works in some common use cases, and show how to configure it.
Why Deep Service Insight?
The standard Kubernetes liveness, readiness, and startup probes give you some information about the backend services running in your clusters, but not enough for the kind of insight you need to make better routing decisions all the way up your stack. Lacking the right information becomes even more problematic as your Kubernetes deployments grow in complexity and your business requirements for uninterrupted uptime become more pressing.
A common approach to improving uptime as you scale your Kubernetes environment is to deploy load balancers, DNS managers, and other automated decision systems in front of your clusters. However, because of how Ingress controllers work, a load balancer sitting in front of a Kubernetes cluster normally has no access to status information about the services behind the Ingress controller in the cluster – it can verify only that the Ingress controller pods themselves are healthy and accepting traffic.
NGINX Ingress Controller, on the other hand, does have information about service health. It already monitors the health of the upstream pods in a cluster by sending periodic passive health checks for HTTP, TCP, UDP, and gRPC services, monitoring request responsiveness, and tracking successful response codes and other metrics. It uses this information to decide how to distribute traffic across your services’ pods to provide a consistent and predictable user experience. Normally, NGINX Ingress Controller is performing all this magic silently in the background, and you might never think twice about what’s happening under the hood. Deep Service Insight “surfaces” this valuable information so you can use it more effectively at other layers of your stack.
How Does Deep Service Insight Work?
Deep Service Insight is available for services you deploy using the NGINX VirtualServer and TransportServer custom resources (for HTTP and TCP/UDP respectively). Deep Service Insight uses the NGINX Plus API to share NGINX Ingress Controller’s view of the individual pods in a backend service at a dedicated endpoint unique to Deep Service Insight:
- For VirtualServer – <IP_address> :<port> /probe/<hostname>
- For TransportServer – <IP_address> :<port> /probe/ts/<service_name>
where
- <IP_address> belongs to NGINX Ingress Controller
- <port> is the Deep Service Insight port number (9114 by default)
- <hostname> is the domain name of the service as defined in the
spec.hostfield of the VirtualServer resource - <service_name> is the name of the service as defined in the
spec.upstreams.servicefield in the TransportServer resource
The output includes two types of information:
-
An HTTP status code for the hostname or service name:
200OK– At least one pod is healthy418I’mateapot– No pods are healthy404NotFound– There are no pods matching the specified hostname or service name
-
Three counters for the specified hostname or service name:
Totalnumber of service instances (pods)- Number of pods in the
Up(healthy) state - Number of pods in the
Unhealthystate
Here’s an example where all three pods for a service are healthy:
HTTP/1.1 200 OK
Content-Type: application/json; charset=utf-8
Date: Day, DD Mon YYYY hh:mm:ss TZ
Content-Length: 32
{"Total":3,"Up":3,"Unhealthy":0}
For more details, see the NGINX Ingress Controller documentation.
You can further customize the criteria that NGINX Ingress Controller uses to decide a pod is healthy by configuring active health checks. You can configure the path and port to which the health check is sent, the number of failed checks that must occur within a specified time period for a pod to be considered unhealthy, the expected status code, timeouts for connecting or receiving a response, and more. Include the Upstream.Healthcheck field in the VirtualServer or TransportServer resource.
Sample Use Cases for Deep Service Insight
One use case where Deep Service Insight is particularly valuable is when a load balancer is routing traffic to a service that’s running in two clusters, say for high availability. Within each cluster, NGINX Ingress Controller tracks the health of upstream pods as described above. When you enable Deep Service Insight, information about the number of healthy and unhealthy upstream pods is also exposed on a dedicated endpoint. Your routing decision system can access the endpoint and use the information to divert application traffic away from unhealthy pods in favor of healthy ones.
The diagram illustrates how Deep Service Insight works in this scenario.
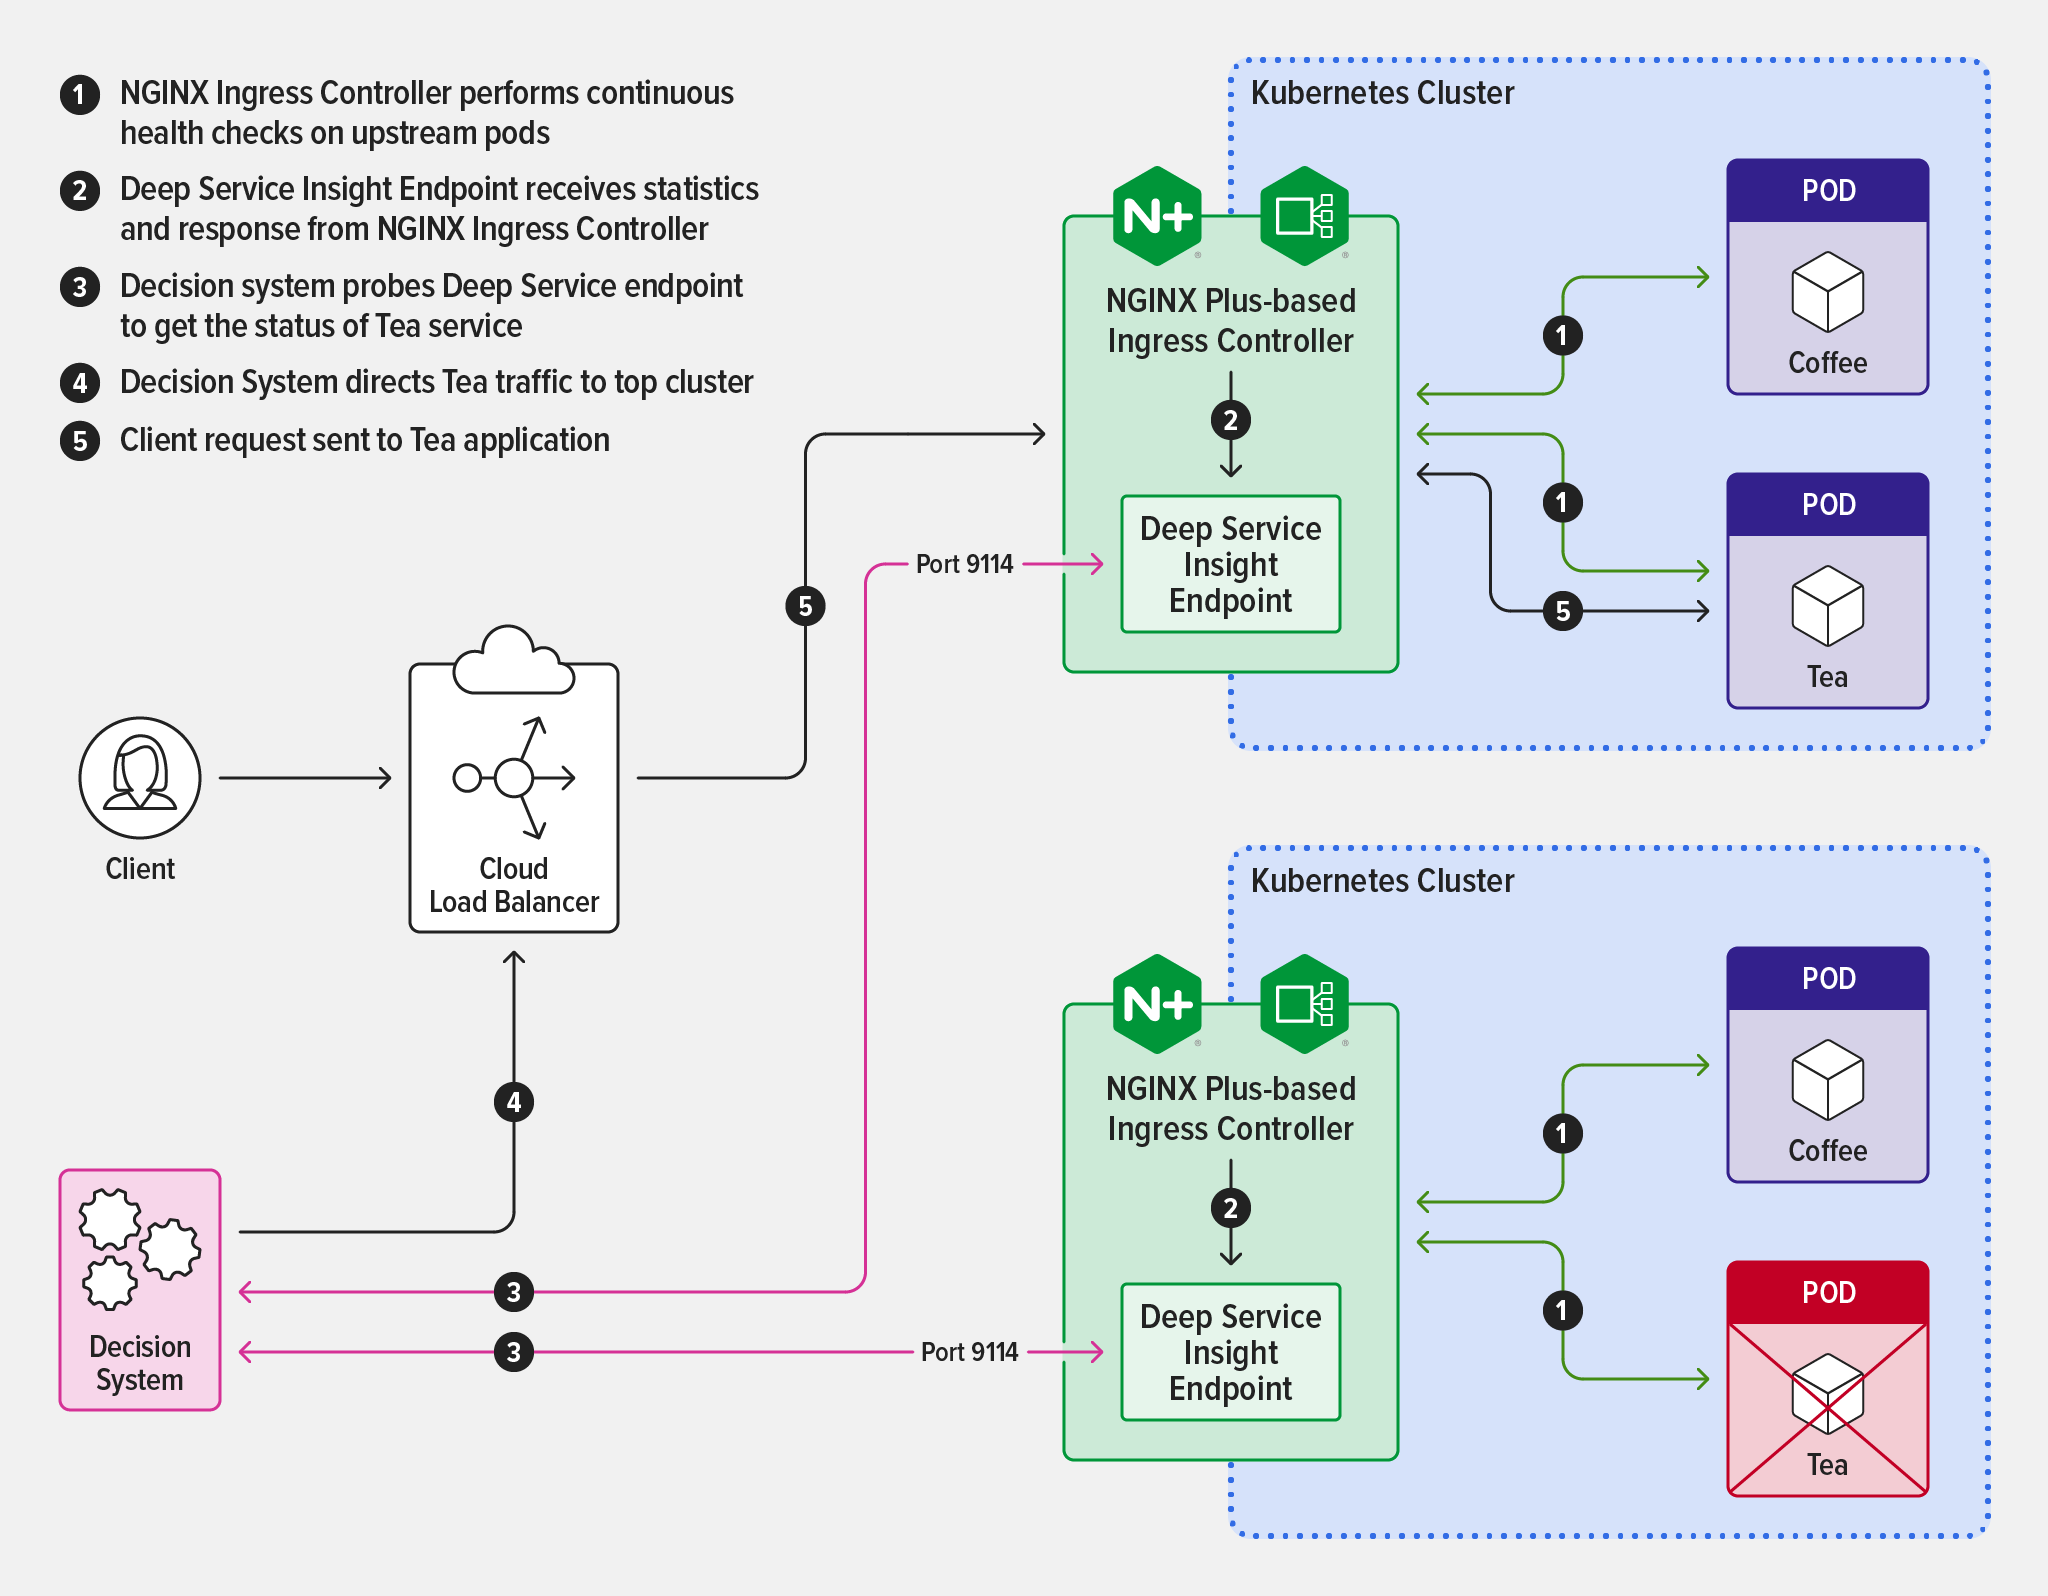
You can also take advantage of Deep Service Insight when performing maintenance on a cluster in a high‑availability scenario. Simply scale the number of pods for a service down to zero in the cluster where you’re doing maintenance. The lack of healthy pods shows up automatically at the Deep Service Insight endpoint and your routing decision system uses that information to send traffic to the healthy pods in the other cluster. You effectively get automatic failover without having to change configuration on either NGINX Ingress Controller or the system, and your customers never experience a service interruption.
Enabling Deep Service Insight
To enable Deep Service Insight, include the -enable-service-insight command‑line argument in the Kubernetes manifest, or set the serviceInsight.create parameter to true if using Helm.
There are two optional arguments which you can include to tune the endpoint for your environment:
-service-insight-listen-port<port>– Change the Deep Service Insight port number from the default, 9114 (<port>is an integer in the range 1024–65535). The Helm equivalent is theserviceInsight.portparameter.-service-insight-tls-string<secret>– A Kubernetes secret (TLS certificate and key) for TLS termination of the Deep Service Insight endpoint (<secret>is a character string with format<namespace>/<secret_name>). The Helm equivalent is theserviceInsight.secretparameter.
Example: Enable Deep Service Insight for the Cafe Application
To see Deep Service Insight in action, you can enable it for the Cafe application often used as an example in the NGINX Ingress Controller documentation.
-
Install the NGINX Plus edition of NGINX Ingress Controller with support for NGINX custom resources and enabling Deep Service Insight:
- If using Helm, set the
serviceInsight.createparameter totrue. - If using a Kubernetes manifest (Deployment or DaemonSet), include the
-enable-service-insightargument in the manifest file.
- If using Helm, set the
-
Verify that NGINX Ingress Controller is running:
$ kubectl get pods -n nginx-ingress NAME READY ... ingress-plus-nginx-ingress-6db8dc5c6d-cb5hp 1/1 ... ... STATUS RESTARTS AGE ... Running 0 9d - Deploy the Cafe application according to the instructions in the README.
-
Verify that the NGINX VirtualServer custom resource is deployed for the Cafe application (the IP address is omitted for legibility):
$ kubectl get vs NAME STATE HOST IP PORTS AGE cafe Valid cafe.example.com ... [80,443] 7h1m -
Verify that there are three upstream pods for the Cafe service running at cafe.example.com:
$ kubectl get pods NAME READY STATUS RESTARTS AGE coffee-87cf76b96-5b85h 1/1 Running 0 7h39m coffee-87cf76b96-lqjrp 1/1 Running 0 7h39m tea-55bc9d5586-9z26v 1/1 Running 0 111m -
Access the Deep Service Insight endpoint:
$ curl -i <NIC_IP_address>:9114/probe/cafe.example.comThe
200OKresponse code indicates that the service is ready to accept traffic (at least one pod is healthy). In this case all three pods are in the Up state.HTTP/1.1 200 OK Content-Type: application/json; charset=utf-8 Date: Day, DD Mon YYYY hh:mm:ss TZ Content-Length: 32 {"Total":3,"Up":3,"Unhealthy":0}The
418I’mateapotstatus code indicates that the service is unavailable (all pods are unhealthy).HTTP/1.1 418 I'm a teapot Content-Type: application/json; charset=utf-8 Date: Day, DD Mon YYYY hh:mm:ss TZ Content-Length: 32 {"Total":3,"Up":0,"Unhealthy":3}The
404NotFoundstatus code indicates that there is no service running at the specified hostname.HTTP/1.1 404 Not Found Date: Day, DD Mon YYYY hh:mm:ss TZ Content-Length: 0
Resources
For the complete changelog for NGINX Ingress Controller release 3.0.0, see the Release Notes.
To try NGINX Ingress Controller with NGINX Plus and NGINX App Protect, start your 30-day free trial today or contact us to discuss your use cases.