
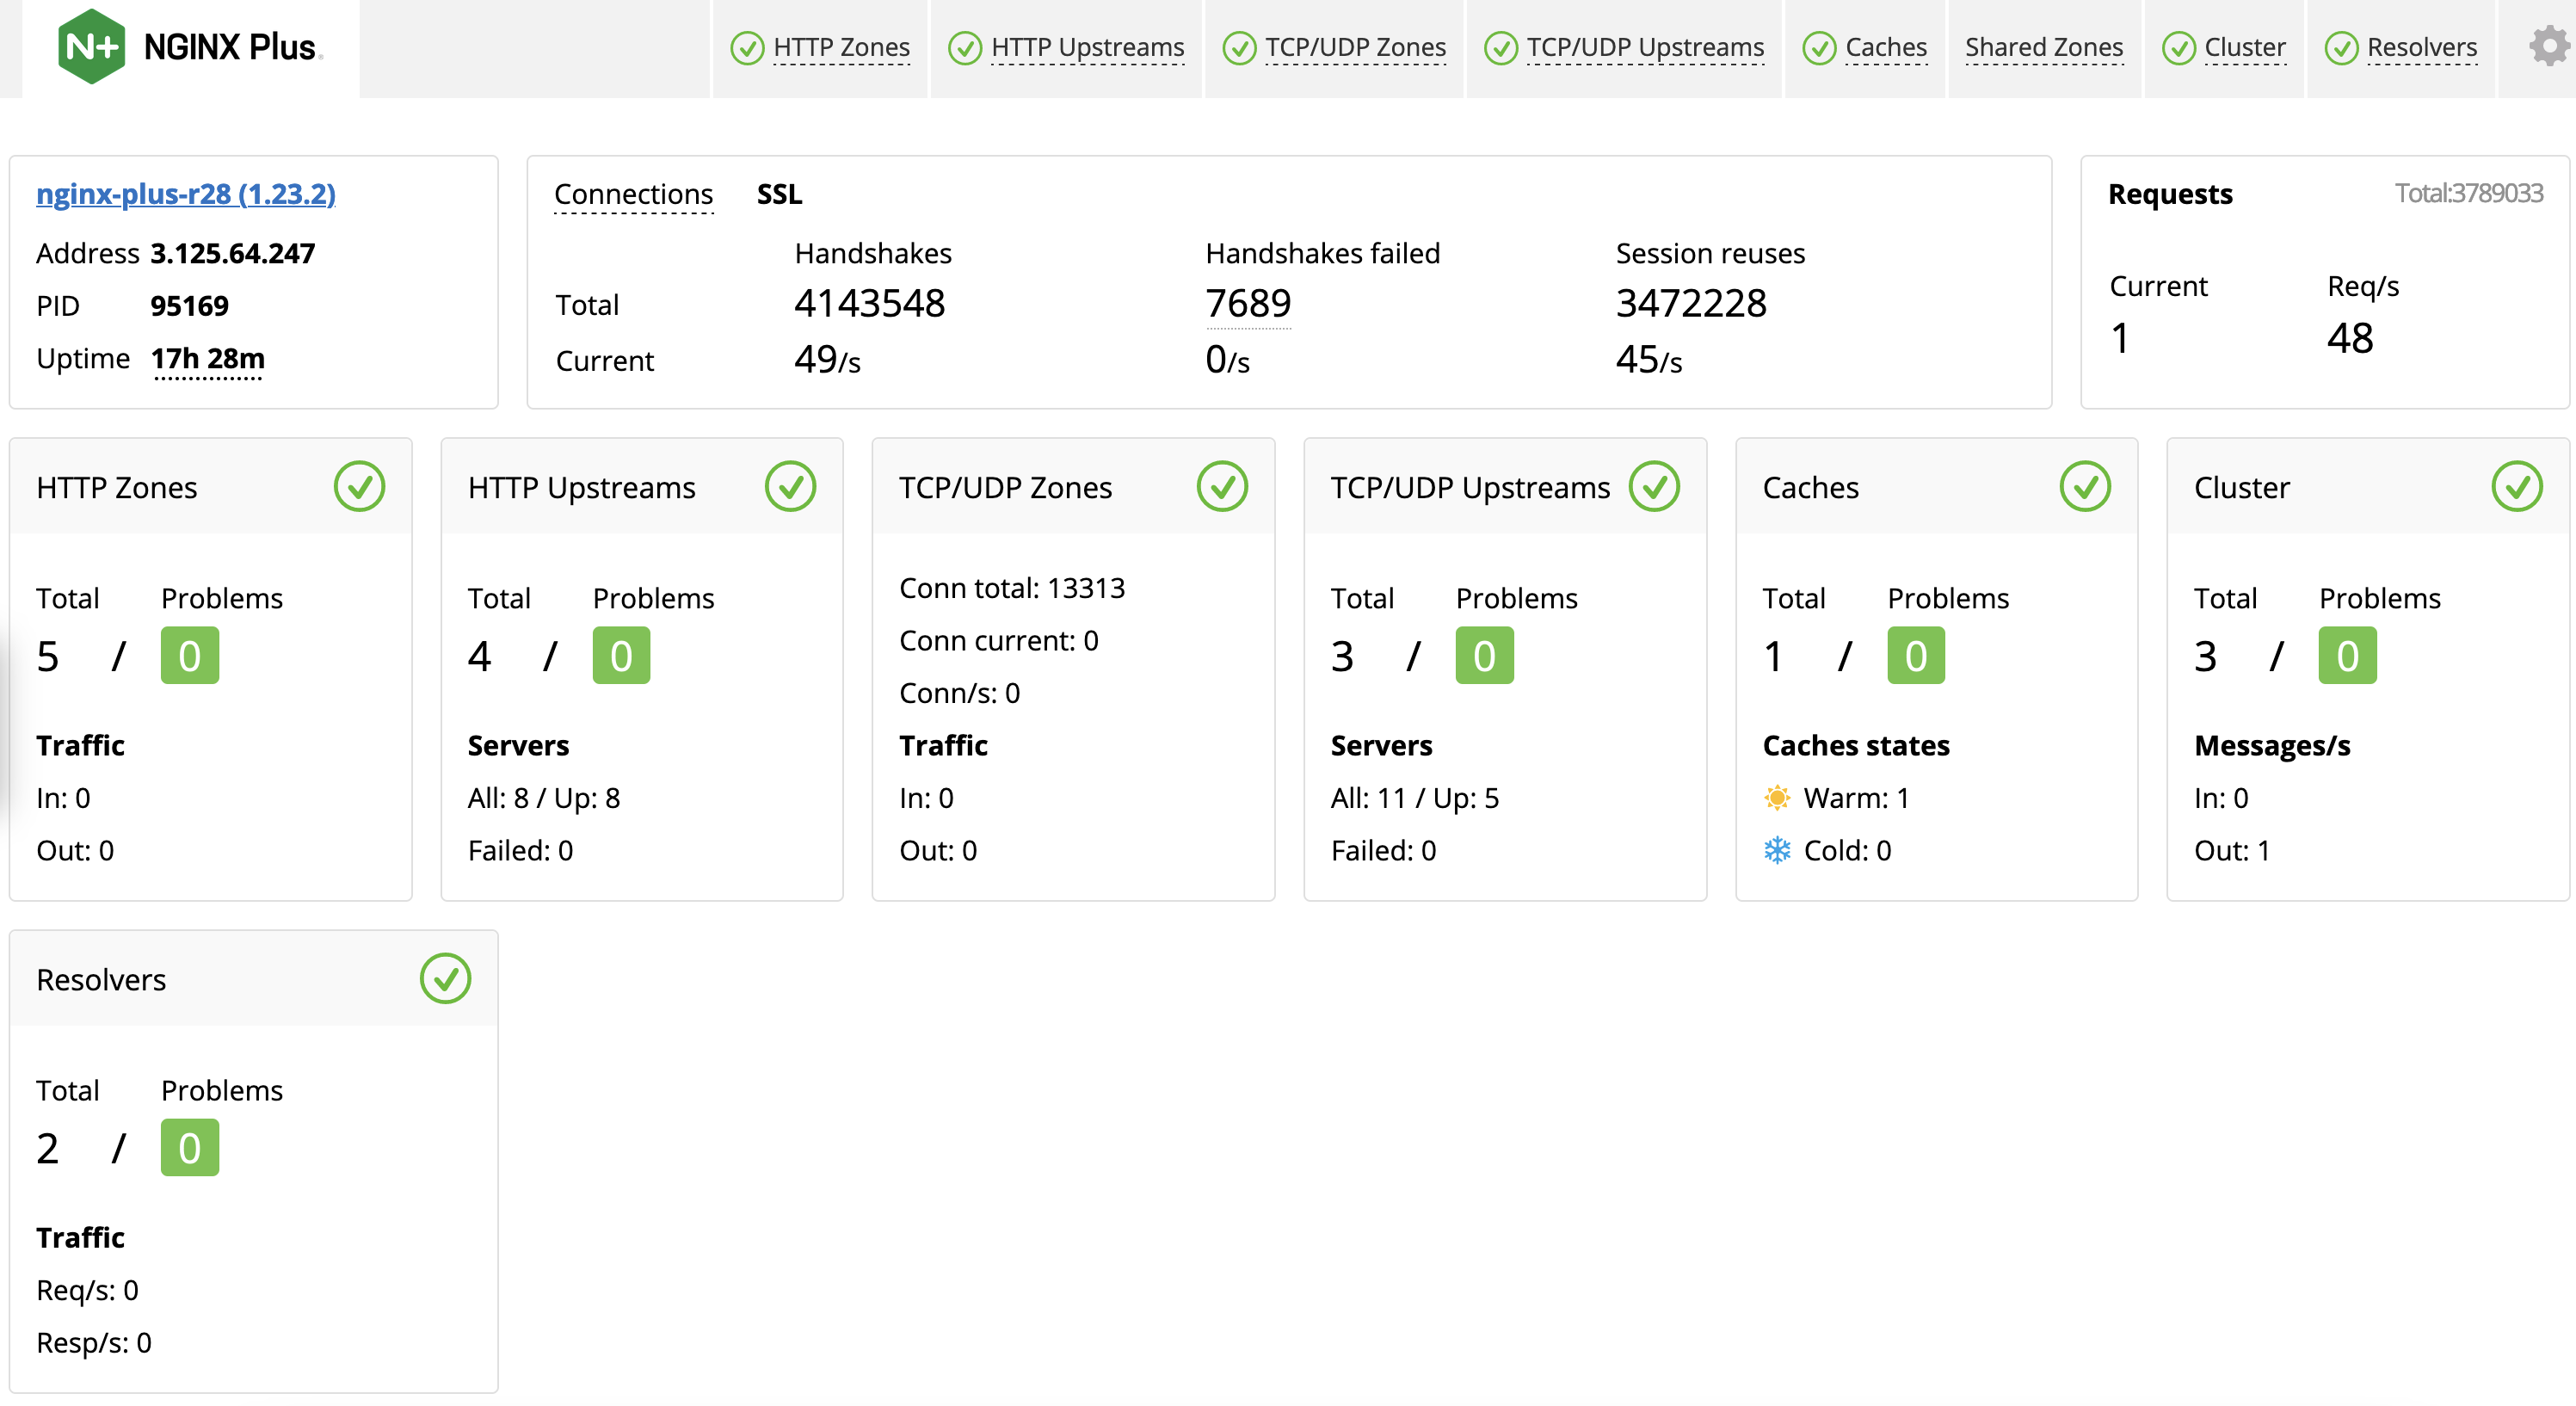
Ever needed to know what’s going on right now with your NGINX Plus server? Do you suspect a DDoS attack, or are users reporting errors from your website? NGINX Plus includes a real‑time activity monitoring interface that provides key load and performance metrics. Using a simple RESTful JSON interface, it’s very easy to connect these stats to live dashboards and third‑party monitoring tools.
The live activity monitoring data is generated by the NGINX Plus API. You can configure live activity monitoring as follows:
server {
    listen 8080;

    location /api {
        api write=on;
        # directives limiting access to the API
    }

    location = /dashboard.html {
        root   /usr/share/nginx/html;
    }

    # Redirect requests made to the pre-NGINX Plus API dashboard
    location = /status.html {
        return 301 /dashboard.html;
    }
}
The write=on parameter is required if you want to use the API to reconfigure upstream groups or clear the set of collected statistics. It is not required to retrieve status information.
We recommend that you restrict access to the /api location. The NGINX Plus Admin Guide describes appropriate security schemes in more detail.
In Detail – The Live Activity Monitoring JSON Feed
When you access the API, NGINX Plus returns a JSON‑formatted document containing the current statistics. You can request complete statistics at /api/api-version/, where api-version is the version number of the NGINX Plus API. You can also drill down to obtain subsets of the data or single data points, at specific API endpoints, including these:
- /api/api-version/nginx/ – Basic version, uptime, and identification information
- /api/api-version/connections/ – Total active and idle connections
- /api/api-version/http/caches/ – Instrumentation for each named cache zone
- /api/api-version/http/server_zones/ – Request and response counts for each HTTP status zone
- /api/api-version/http/upstreams/ – Request and response counts, response time, health‑check status, and uptime statistics per server in each HTTP upstream group
- /api/api-version/limit_conns/ – Rate‑limiting statistics indicating the number of passed, rejected, and delayed connections
- /api/api-version/limit_reqs/ – Rate‑limiting statistics indicating the number of passed, rejected, and delayed requests
- /api/api-version/stream/upstreams/ – Request and response counts, response time, health‑check status, and uptime statistics per server in each TCP/UDP upstream group
- /api/api-version/ssl/ – SSL/TLS statistics
For a list of all endpoints, see the reference documentation or the Swagger UI at demo.nginx.com.
External Monitoring
You can also export NGINX Plus metrics to your choice of external monitoring tools. NGINX Plus integrates with popular third‑party and NGINX tools like these:
- AppDynamics
- Datadog
- Dynatrace
- F5 Beacon
- F5 NGINX Management Suite [formerly NGINX Controller]
- New Relic
- Splunk
