
We all know that performance is critical to a website’s success. No one wants to use a slow website.
Since its initial open source release in 2004, NGINX has been synonymous with high‑performance websites. More of the world’s websites use NGINX than any other web server, and more than 350 million sites worldwide are now powered by NGINX. But how well does NGINX actually perform? What hardware configurations will yield the best performance at a reasonable price?
We previously published performance statistics for NGINX and NGINX Plus as a reverse proxy in our NGINX Plus Sizing Guide for Bare Metal Servers and detailed our testing methodolgy in NGINX Plus Sizing Guide: How We Tested.
Since publishing those pieces, we’ve received many requests for information about the performance of NGINX as a web server, so we went back into the lab. In this blog post, we present detailed performance numbers from our testing: requests per second (RPS) and connections per second (CPS) on live HTTP and HTTPS connections, and HTTP throughput on 50 dedicated channels. The results apply to both NGINX Open Source and NGINX Plus (none of the testing relies on features that are exclusive to NGINX Plus).
Our goal is that this information helps you determine the hardware specs you need to handle current and future traffic for your web application, taking into account your budget and performance needs.
Testing Overview
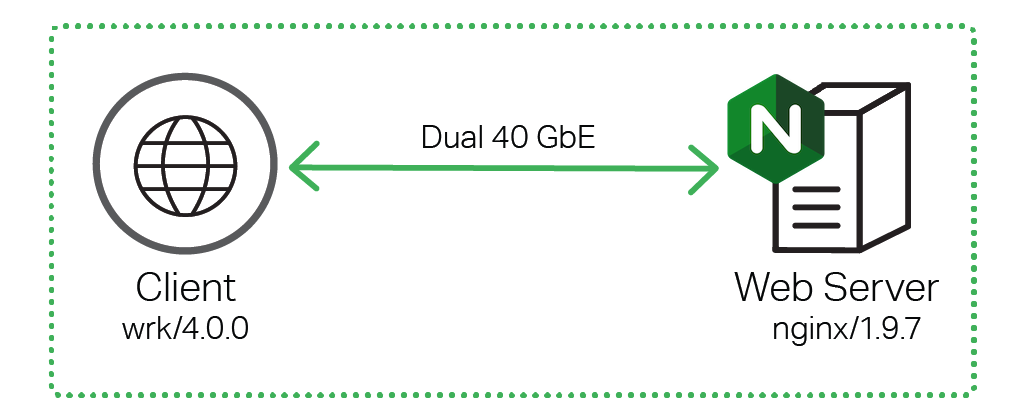
The testing setup we used is almost identical to the setup in NGINX Plus Sizing Guide: How We Tested, except there is no reverse proxy between the client and the web server. All tests were done using two separate machines connected together with dual 40‑GbE links in a simple, flat Layer 2 network.
to test NGINX performance
To simulate different numbers of CPUs in the tests, we varied the number of NGINX worker processes. By default, the number of NGINX worker processes that start executing equates to the number of CPUs available in the machine where NGINX is running. You can change the number of NGINX worker processes executing by changing the value of the worker_processes directive in the /etc/nginx/nginx.conf file and restarting the NGINX service.
For tests where client traffic was secured with HTTPS, we used the following encryption parameters:
ECDHE-RSA-AES256-GCM-SHA384cipher- 2,048‑bit RSA key
- Perfect forward secrecy (as indicated by
ECDHEin the cipher name) - OpenSSL 1.0.1f
Hardware Used
We used the following hardware for the testing on both the client and web server machine:
- CPU: 2x Intel(R) Xeon(R) CPU E5‑2699 v3 @ 2.30 GHz, 36 real (or 72 HT) cores
- Network: 2x Intel XL710 40 GbE QSFP+ (rev 01)
- Memory: 16 GB
Software Used
We used the following software for the testing:
- Version 4.0.0 of
wrkrunning on the client machine generated the traffic that NGINX proxied. We installed it according to these instructions. - Version 1.9.7 of NGINX Open Source ran on the web server machines. We installed it from the official repository at nginx.org according to these instructions.
- Ubuntu Linux 14.04.1 ran on both client and web server machines.
Performance Metrics and Analysis
We obtained the following performance numbers from the tests. For the commands used, see NGINX Plus Sizing Guide: How We Tested.
Requests per Second
Requests per second (RPS) measures the ability to process HTTP requests. Each request is sent from the client machine to the NGINX web server. The tests were done for both unencrypted HTTP and encrypted HTTPS traffic.
Following common practice for performance testing, we used four standard file sizes:
- 0 KB simulates an “empty” HTTP request or response with no accompanying data, such as a
302error code. - 1 KB is roughly the size of small CSS or JavaScript files or a very small image, such as a small icon.
- 10 KB approximates larger code files, larger icons, and small image files.
- 100 KB represents large code files and other larger files.
Issuing small HTTP requests gives you more requests per second, with less total throughput. Issuing large HTTP requests gives you fewer requests per second and more throughput, as a single request initiates a large file transfer that takes an appreciable amount of time to complete.
RPS for HTTP Requests
The table and graph below show the number of HTTP requests for varying numbers of CPUs and varying request sizes, in kilobytes (KB).
| CPUs | 0 KB | 1 KB | 10 KB | 100 KB |
|---|---|---|---|---|
| 1 | 145,551 | 74,091 | 54,684 | 33,125 |
| 2 | 249,293 | 131,466 | 102,069 | 62,554 |
| 4 | 543,061 | 261,269 | 207,848 | 88,691 |
| 8 | 1,048,421 | 524,745 | 392,151 | 91,640 |
| 16 | 2,001,846 | 972,382 | 663,921 | 91,623 |
| 32 | 3,019,182 | 1,316,362 | 774,567 | 91,640 |
| 36 | 3,298,511 | 1,309,358 | 764,744 | 91,655 |

Large HTTP requests (such as the 10 and 100 KB sizes in the test) are fragmented and take longer to process. As a result, the lines in the graph for larger requests have flatter slopes.
When balancing budget versus performance, one interesting thing to note is that the slope of the lines changes as you pass 16 CPUs. Servers with 32 CPUs performed the same or better than those with 36 CPUs for 1 KB and 10 KB request sizes. Resource contention eventually outweighs the positive effect of adding more CPUs. This suggests that common server configurations for HTTP traffic of 4 to 8 cores might benefit strongly from adding CPUs up to a total of 16, less so from using 32, and with little or no benefit from moving to 36. However, as is always true with regard to testing, your mileage may vary.
RPS for HTTPS Requests
HTTPS RPS is lower than HTTP RPS for the same provisioned bare‑metal hardware because the data encryption and decryption necessary to secure data transmitted between machines is computationally expensive.
Nonetheless, continued advances in Intel architecture – resulting in servers with faster processors and better memory management – mean that the performance of software for CPU‑bound encryption tasks continually improves compared to dedicated hardware encryption devices.
Though RPS for HTTPS are roughly one‑quarter less than for HTTP at the 16‑CPU mark, “throwing hardware at the problem” – in the form of additional CPUs – is more effective than for HTTP, for the more commonly used file sizes and all the way up to 36 CPUs.
| CPUs | 0 KB | 1 KB | 10 KB | 100 KB |
|---|---|---|---|---|
| 1 | 71,561 | 40,207 | 23,308 | 4,830 |
| 2 | 151,325 | 85,139 | 48,654 | 9,871 |
| 4 | 324,654 | 178,395 | 96,808 | 19,355 |
| 8 | 647,213 | 359,576 | 198,818 | 38,900 |
| 16 | 1,262,999 | 690,329 | 383,860 | 77,427 |
| 32 | 2,197,336 | 1,207,959 | 692,804 | 90,430 |
| 36 | 2,175,945 | 1,239,624 | 733,745 | 89,842 |
Connections per Second
Connections per second (CPS) measures the ability of NGINX to create new TCP connections back to clients that have made requests. Clients send a series of HTTP or HTTPS requests, each on a new connection. NGINX parses the requests and sends back a 0‑byte response for each request. The connection is closed after the request is satisfied.
Note: The HTTPS variant of this test is often called SSL transactions per second (SSL TPS).
CPS for HTTP Requests
The table and graph show CPS for HTTP requests across different numbers of CPUs.
| CPUs | CPS |
|---|---|
| 1 | 34,344 |
| 2 | 54,368 |
| 4 | 123,164 |
| 8 | 194,967 |
| 16 | 255,032 |
| 32 | 261,033 |
| 36 | 257,277 |

The graph resembles f(x) = √x, where x is the number of CPUs running. As for RPS, CPS growth flattens at around 16 CPUs, and there is a slight decrease in performance (here, in CPS) when we increase the number of CPUs from 32 to 36.
CPS for HTTPS Requests
The table and graph show CPS for HTTPS requests. Because of timing constraints, we did not run the tests with 32 CPUs.
| CPUs | CPS |
|---|---|
| 1 | 428 |
| 2 | 869 |
| 4 | 1,735 |
| 8 | 3,399 |
| 16 | 6,676 |
| 24 | 10,274 |
| 36 | 10,067 |
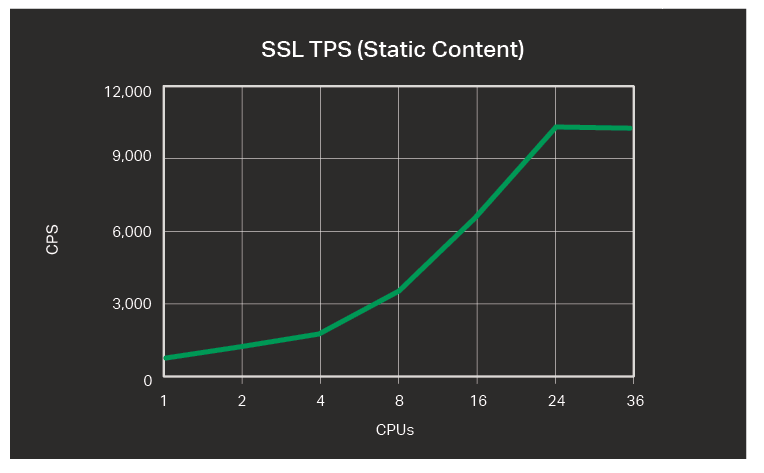
We observe a higher rate of CPS increase the more we add CPUs. The graphic line flattens out at 24 CPUs. For SSL, throwing hardware at the problem works well.
Throughput
These tests measure the throughput of HTTP requests (in Gbps) that NGINX is able to sustain over a period of 180 seconds.
| CPUs | 100 KB | 1 MB | 10 MB |
|---|---|---|---|
| 1 | 13 | 48 | 68 |
| 2 | 20 | 69 | 71 |
| 4 | 45 | 67 | 71 |
| 8 | 50 | 68 | 72 |
| 16 | 48 | 66 | 71 |
| 32 | 48 | 66 | 71 |
| 36 | 48 | 66 | 71 |

The throughput is proportional to the size of HTTP requests issued by the client machine. NGINX gets higher throughput when the file size is larger, as a given request results in the transmission of more data. However, performance peaks at around 8 CPUs; more is not necessarily beneficial for throughput‑heavy tasks.
Miscellaneous Notes
A few other notes on the testing and the results:
- Hyper‑threading was available on the CPUs we tested, which means additional NGINX worker processes can run to use the full capacity of the hyper‑threading CPUs. We didn’t enable hyper‑threading for the tests reported here, but we did see improved performance with hyper‑threading in separate tests. Most notably, hyper‑threading improved SSL TPS by about 50%.
- The numbers presented here are with OpenSSL 1.0.1. We also tested with OpenSSL 1.0.2 and saw about a 2x performance improvement. OpenSSL 1.0.1 is still far more widely used, but we recommend moving to OpenSSL 1.0.2, for better security as well as better performance.
- We also tested elliptic curve cryptography (ECC), but the results presented here use RSA. For encryption, RSA is still far more widely used than ECC, though ECC is often deployed for mobile, where efficiency in power consumption is necessary. We saw 2x to 3x performance improvement with ECC compared to standard RSA certificates, and we recommend you consider implementing ECC.
The combination of moving to OpenSSL 1.0.2 and moving to ECC may bring very strong performance improvements. In addition, our results imply that if you currently use 4‑CPU or 8‑CPU servers, moving to 16 CPUs – or even 32 CPUs, for SSL – might result in really dramatic improvement.
Conclusion
We’ve analyzed performance test results for RPS and CPS on live HTTP and HTTPS connections, plus HTTP throughput on 50 dedicated channels. Use the information in this blog to help you decide what hardware specs you need to handle current and future traffic at your site given your budget and performance needs.