In the previous article in this caching series, we looked at the benefits of microcaching – caching dynamic content for very short periods of time – which sometimes leads to very significant performance improvement. In this article, we’ll consider another aspect of caching, that of cache placement, and we’ll look at strategies for dealing with slow cache storage.
Editor –
- For more information about cache placement, see “Shared Caches with NGINX Plus Cache Clusters”, Part 1 and Part 2.
- This post has been updated to refer to the NGINX Plus API, which replaces and deprecates the separate extended status module originally discussed here.
Selecting a Cache Location
NGINX can manage multiple cache locations, each mapped to a different filesystem location, and you can configure NGINX to choose which cache to use on a per‑request basis.
In the following sample configuration, the proxy_cache_path directives create two caches, ssd_cache and disk_cache, mounted on the local directories /mnt/ssd/cache and /mnt/disk/cache respectively. The map directive inspects the request URL and selects disk_cache for all requests that appear to be video downloads (have .mp4 or .avi in the URL). The default ssd_cache location is selected for all other requests.
# Define caches and their locations
proxy_cache_path /mnt/ssd/cache keys_zone=ssd_cache:10m levels=1:2 inactive=600s
                 max_size=700m;
proxy_cache_path /mnt/disk/cache keys_zone=disk_cache:100m levels=1:2 inactive=24h
                 max_size=80G;

# Requests for .mp4 and .avi files go to disk_cache
# All other requests go to ssd_cache
map $request_uri $cache {
    ~.mp4(?.*)?$  disk_cache;
    ~.avi(?.*)?$  disk_cache;

    default ssd_cache;
}

server {
    # select the cache based on the URI
    proxy_cache $cache;

    # ...
}
Note: For a simple deployment, you could create separate location blocks for different URLs and use the proxy_cache directive within each to specify a different cache location.
Where is Cached Data Stored?
NGINX and NGINX Plus utilize a hybrid disk‑and‑memory cache. Whether the cache is on disk, in SSD, or elsewhere, the operating system page cache brings a cached item into main memory when it’s requested. The cached content that was requested least recently is swapped out when memory is required for other purposes. The operating system actively manages the page cache to take advantage of unused main memory on the host.
Metadata about cached content is always stored in main memory, in a shared memory zone accessible by all NGINX worker processes on the host. The zone is allocated with the keys_zone parameter to the proxy_cache_path directive. The NGINX cache_loader process initializes the metadata at startup.
Can I Use tmpfs for Caching?
It is possible to cache to tmpfs – a transient in‑memory filesystem – but that brings some challenges, beyond the obvious lack of persistence across reboots.
tmpfs filesystems are by necessity small because they are limited by the available RAM. NGINX can overfill the cache, because the worker processes add new resources to the cache, and the cache manager process then prunes the cache in the background to maintain the configured max_size. Therefore, it’s necessary to allow for spare capacity when sizing a cache, and this can be wasteful on a small cache file system.
Furthermore, tmpfs filesystems are swapped out to disk when memory is constrained. The memory used by a tmpfs cache could just as effectively be used by the page cache for a larger on‑disk cache.
Optimizing Read Operations
Valentin Bartenev’s blog about thread pools describes in detail how to accelerate read operations with NGINX and NGINX Plus. Although the blog was written from the perspective of web serving, the results are directly applicable to a read‑only cache workload.
If content is available in main memory (because it was recently used or written to cache), cache read operations are immediate; if content is not in main memory, NGINX generally blocks while the content is retrieved from storage. The thread pools feature mitigates this problem by handing the blocking read operation over to an aio thread so that the main NGINX worker thread is not blocked. In the use case described in Valentin’s article, we saw a 9x performance improvement for hot content.
Testing the Effect of Disk Configuration on Cache Write Operations
For the rest of this article, we’ll look at a different kind of workload, dominated by cache write operations, and see how the disk choice affects cache throughput. Disk speed does not just limit the rate at which new content can be added to the cache; the NGINX worker threads can block when the page cache can’t commit new content to disk fast enough, and that can limit overall throughput.
The goal of our tests was to investigate strategies when writing to slow disks.
The Test Framework
Our first test system was a single Amazon EC2 t2.small instance with local SSD storage and two large magnetic EBS block devices:
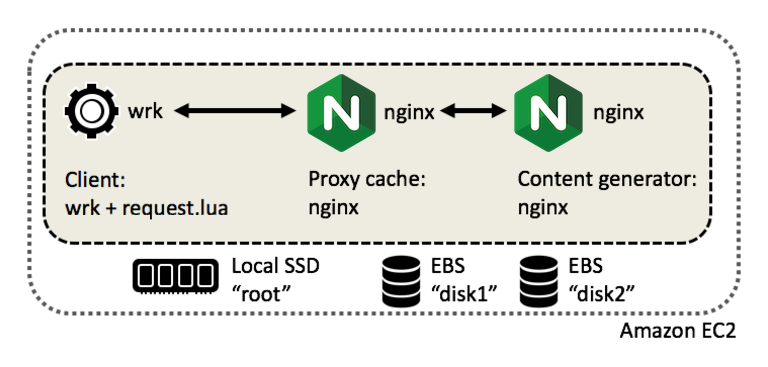
The second test system was a faster bare‑metal server with local hard drives.
We used wrk to generate load. The wrk client ran the following script called request.lua, which configures wrk to generate requests for randomly named files and distribute them across all NGINX workers:
-- Generate requests like GET /753327908949534239.txt
-- See http://stackoverflow.com/a/24097793
math.randomseed( tonumber( tostring( {} ):sub(8) ) + os.time() )

request = function()
   r1 = math.random( 100000000, 999999999 )
   r2 = math.random( 100000000, 999999999 )

   path = "/" .. r1 .. r2 .. ".txt"
   return wrk.format(nil, path)
end
On the content generator, we configured NGINX to return the same 1 MB file for all requests:
location / {
    try_files /1mb.txt =404;
    expires max;
}
Establishing Baseline Throughput
First we ran a wrk test without caching to determine the maximum capacity of the system.
The aggregate throughput on the EC2 instance (for client, proxy, and content generator combined) was about 486 MB/second (3.9 Gbps) on the AWS server:
ubuntu$ ./wrk -c 10 -t 10 -d 60 -s request.lua http://localhost/
Running 1m test @ http://localhost/
  10 threads and 10 connections
  Thread Stats   Avg      Stdev     Max   +/- Stdev
    Latency    20.54ms    1.81ms  58.47ms   93.50%
    Req/Sec    48.68      3.96    80.00     83.30%
  29218 requests in 1.00m, 28.54GB read
Requests/sec:    486.35
Transfer/sec:    486.47MB
The bare‑metal server achieved approximately 6.3 GB/second (50 Gbps) on a similar test.
Measuring Cache Write Performance
We then tested four different configurations of disk volumes:
- Single Disk – Cache writes are directed to a single disk
- Mirror – Cache writes are mirrored across two disks, for redundancy
- Stripe – Cache writes are striped across two physical disks, for performance
- Hash – Cache writes are split across two independent caches, one per disk
To implement the Mirror and Stripe strategies, we used Linux LVS to arrange partitions on the two disks in either a mirror or stripe layout.
To implement the Hash strategy, we included the split_clients directive in the NGINX configuration. This configuration splits cached content evenly between the two caches created by the proxy_cache_path directives, one on each physical disk:
proxy_cache_path /mnt/disk1/cache keys_zone=disk1:100m levels=1:2 inactive=600s
                 max_size=5G use_temp_path=off;
proxy_cache_path /mnt/disk2/cache keys_zone=disk2:100m levels=1:2 inactive=600s
                 max_size=5G use_temp_path=off;

split_clients $request_uri $cache {
    50%     disk1;
    *       disk2;
}

upstream upstreams {
    upstream-server-1;
    upstream-server-2;
    # additional upstream servers
}

server {
    listen localhost:80;

    proxy_cache $cache;

    location / {
        proxy_http_version 1.1;
        proxy_set_header Connection "";
        proxy_pass http://upstreams;
    }

    status_zone loadbalancer;
}
We tested the four strategies on both the Amazon EC2 server (where we expected slow and unpredictable disk speeds) and on the faster bare‑metal server.
During all of the tests, disk I/O was the limiting factor, and iostat illustrated (within sampling bias) the load on individual physical and virtual disks. For example, this output shows activity when testing the Stripe strategy, represented by the virtual dm‑0 device backed by the physical xvdb and xvdc devices:
ubuntu$ iostat 3
avg-cpu:  %user   %nice %system %iowait  %steal   %idle
           0.00    0.00    0.55   98.89    0.55    0.00

Device:            tps    kB_read/s    kB_wrtn/s    kB_read    kB_wrtn
xvda              0.00         0.00         0.00          0          0
xvdb            267.87       141.83     32803.32        512     118420
xvdc            252.35         0.00     32131.72          0     115995
dm-0           1178.67         0.00     59157.89          0     213560
dm-1              0.28         0.00         0.97          0          3
dm-2              2.22       141.83         0.00        512          0
dm-3              2.22         0.00       141.83          0        512
dm-4              0.00         0.00         0.00          0          0
We obtained the following results by averaging across a large number of test runs (20 or more) for each strategy. The results from the EC2 tests showed wide variability, whereas the bare‑metal tests were much more consistent once the system reached a steady state:
| Cache Strategy | Throughput on EC2 (MB/s) | Throughput on Bare Metal (MB/s) |
|---|---|---|
| Single Disk | 39.8 | 95.0 |
| Mirror | 31.5 | 81.0 |
| Stripe | 51.1 | 192.5 |
| Hash | 56.0 | 215.3 |
Mitigating Unpredictable Factors
Disk I/O adds a lot of unpredictability to the system performance, and we took care to ensure that the caches were flushed and empty before each test run.
The NGINX cache_manager process runs regularly and is responsible for pruning the cache in the background. Because the cache was being filled so quickly, cache_manager had to trim the cache aggressively to keep it within limits and make a measurable impact on performance.
We used NGINX Plus’ live activity monitoring dashboard (backed by the NGINX Plus API module) to monitor cache usage in real time, making sure that the caches did not fill completely during the tests:
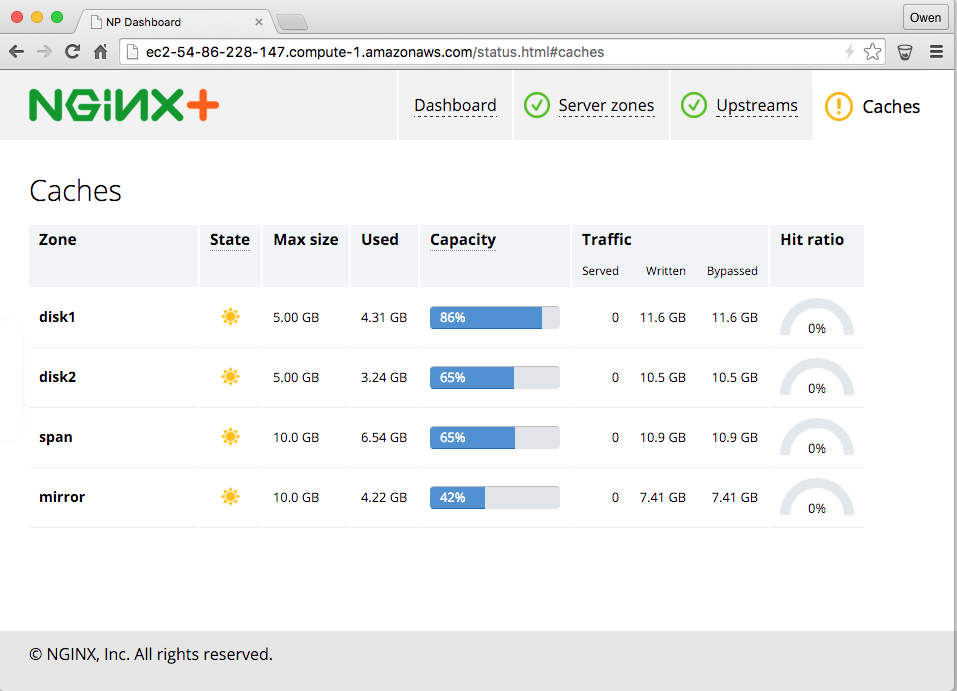
The hit rate reported on the dashboard never went above 0%, confirming that the load generator was creating random, nonrepeating URLs.
Analysis
The goal of this artificial benchmark is to test the performance of different cache configurations; the test fills the cache as quickly as possible with 1 MB files that are never requested again after the first time (no reuse, which is highly artificial).
The simple Single Disk strategy is the baseline against which we can compare the more complex arrangements.
Not surprisingly, the Mirror strategy was marginally slower that Single Disk. Even though the writes can be done together between the two physical disks, Mirror incurs a small amount of overhead. Nevertheless, you might wish to use a mirrored arrangement so that your cache is not vulnerable to the failure of a single disk.
Stripe and Hash are both faster than Single Disk. The Hash results are higher than expected (more than twice the speed of Single Disk) but the tests were consistent and easily replicated. Hash appears to be marginally faster than Stripe.
Want to try out caching strategies with NGINX Plus in your own enviroment? Start your free 30-day trial today or contact us to discuss your use cases.