NGINX.COM
Web Server Load Balancing with NGINX Plus

Shaping the Future of Kubernetes Application Connectivity with F5 NGINX

Application connectivity in Kubernetes can be extremely complex, especially when you deploy hundreds – or even thousands – of containers across various cloud environments, including on-premises, public, private, or hybrid and multi-cloud. At NGINX, we firmly believe that integrating a unified approach to manage connectivity to, from, and within a Kubernetes cluster can dramatically simplify and streamline operations for development, infrastructure, platform engineering, and security teams.

In this blog, we want to share some reflections and thoughts on how NGINX created one of the most popular Ingress controllers today, and ways we plan continue delivering the best-in-class capabilities to manage Kubernetes app connectivity in the future.

Also, don’t miss a chance to chat with our engineers and architects to discover the latest cool and exciting projects that NGINX is working on and see these technologies in action. NGINX, a part of F5, is proud to be a Platinum Sponsor of KubeCon North America 2023, and we hope to see you there! Come meet us at the NGINX booth to discuss how we can help enhance security, scalability, and observability of your Kubernetes platform.

Before anything, we want to note the importance of putting the customer first. NGINX does so by looking at each customer’s specific scenario and use cases, goals they aim to achieve, and challenges they might encounter on their journey. Then, we develop a solution leveraging our technology innovations that helps the customer achieve those goals and address any challenges in the most efficient way.

Ingress Controller

In 2017, we released the first version of NGINX Ingress Controller to answer the demand for enterprise-class Kubernetes-native app delivery. NGINX Ingress Controller helps improve user experience with load balancing, SSL termination, URI rewrites, session persistence, JWT authentication, and other key application delivery features. It is built on the most popular data plan in the world – NGINX – and leverages the Kubernetes Ingress API.

After its release, NGINX Ingress Controller gained immediate traction due to its ease of deployment and configuration, low resource utilization (even under heavy loads), and fast and reliable operations.

Ingress Controller ecosystem diagram

As our journey advanced, we reached limitations with the Ingress object in the Kubernetes API, such as support for protocols other than HTTP and the inability to attach customized request-handling policies like security policy. Due to these limitations, we introduced Custom Resource Definitions (CRDs) to enhance NGINX Ingress Controller capabilities and enable advanced use cases for our customers.

NGINX Ingress Controller provides the CRDs VirtualServer, VirtualServerRoute, TransportServer, and Policy to enhance performance, resilience, uptime, and security, along with observability for the API gateway, load balancer, and Ingress functionality at the edge of a Kubernetes cluster. In support of frequent app releases, these NGINX CRDs also enable role-oriented self-service governance across multi-tenant development and operations teams.

Ingress Controller custom resources

With our most recent release at the time of writing (version 3.1), we added JWT authorization and introduced Deep Service Insight to help customers monitor status of their apps behind NGINX Ingress Controller. This helps implement advanced failover scenarios (e.g., from on-premises to cloud ). Many other features are planned in the roadmap, so stay tuned for the new releases.

Learn more about how you can reduce complexity, increase uptime, and provide better insights into app health and performance at scale on the NGINX Ingress Controller web page.

Service Mesh

In 2020, we continued our Kubernetes app connectivity journey by introducing NGINX Service Mesh, a purpose-built, developer-friendly, lightweight yet comprehensive solution to power a variety of service-to-service connectivity use cases, including security and visibility, within the Kubernetes cluster.

NGINX Service Mesh Control and Data Planes

NGINX Service Mesh and NGINX Ingress Controller leverage the same data plane technology and can be tightly and seamlessly integrated for unified connectivity to, from, and within a cluster.

Prior to the latest release (version 2.0), NGINX Service Mesh used SMI specifications and a bespoke API server to deliver service-to-service connectivity within a Kubernetes cluster. With version 2.0, we decided to deprecate the SMI resources and replace them by mimicking the resources from Gateway API for Mesh Management and Administration (GAMMA). With this approach, we ensure unified north-south and east-west connectivity that leverages the same CRD types, simplifying and streamlining configuration and operations.

NGINX Service Mesh is available as a free download from GitHub.

Gateway API

The Gateway API is an open source project intended to improve and standardize app and service networking in Kubernetes. Managed by the Kubernetes community, the Gateway API specification evolved from the Kubernetes Ingress API to solve limitations of the Ingress resource in production environments. These limitations include defining fine-grained policies for request processing and delegating control over configuration across multiple teams and roles. It’s an exciting project – and since the Gateway API’s introduction, NGINX has been an active participant.

Gateway API Resources

That said, we intentionally didn’t want to include the Gateway API specifications in NGINX Ingress Controller because it already has a robust set of CRDs that cover a diverse variety of use cases, and some of those use cases are the same ones the Gateway API is intended to address.

In 2021, we decided to spin off a separate new project that covers all aspects of Kubernetes connectivity with the Gateway API: NGINX Kubernetes Gateway.

We decided to start our NGINX Kubernetes Gateway project, rather than just using NGINX Ingress Controller, for these reasons:

  • To ensure product stability, reliability, and production readiness (we didn’t want to include beta-level specs into a mature, enterprise-class Ingress controller).
  • To deliver comprehensive, vendor-agnostic configuration interoperability for Gateway API resources without mixing them with vendor-specific CRDs.
  • To experiment with data and control plane architectural choices and decisions with the goal to provide easy-to-use, fast, reliable, and secure Kubernetes connectivity that is future-proof.

In addition, the Gateway API formed a GAMMA subgroup to research and define capabilities and resources of the Gateway API specifications for service mesh use cases. Here at NGINX, we see the long-term future of unified north-south and east-west Kubernetes connectivity in the Gateway API and heading in this direction.

The Gateway API is truly a collaborative effort across vendors and projects – all working together to build something better for Kubernetes users, based on experience and expertise, common touchpoints, and joint decisions. There will always be room for individual implementations to innovate and for data planes to shine. With NGINX Kubernetes Gateway, we continue working on native NGINX implementation of the Gateway API, and we encourage you to join us in shaping the future of Kubernetes app connectivity.

Ways you can get involved in NGINX Kubernetes Gateway include:

  • Join the project as a contributor
  • Try the implementation in your lab
  • Test and provide feedback

To join the project, visit NGINX Kubernetes Gateway on GitHub.

Even with this evolution of the Kubernetes Ingress API, NGINX Ingress Controller is not going anywhere and will stay here for the foreseeable future. We’ll continue to invest into and develop our proven and mature technology to satisfy both current and future customer needs and help users who need to manage app connectivity at the edge of a Kubernetes cluster.

Get Started Today

To learn more about how you can simplify application delivery with NGINX Kubernetes solutions, visit the Connectivity Stack for Kubernetes web page.

Optimizing MQTT Deployments in Enterprise Environments with NGINX Plus

When announcing the R29 release of NGINX Plus, we briefly covered its new native support for parsing MQTT messages. In this post, we’ll build on that and discuss how NGINX Plus can be configured to optimize MQTT deployments in enterprise environments.

What Is MQTT?

MQTT stands for Message Queuing Telemetry Transport. It’s a very popular, lightweight publish-subscribe messaging protocol, ideal for connecting Internet of Things (IoT) or machine-to-machine (M2M) devices and applications over the internet. MQTT is designed to operate efficiently in low-bandwidth or low-power environments, making it an ideal choice for applications with a large number of remote clients. It’s used in a variety of industries, including consumer electronics, automotive, transportation, manufacturing, and healthcare.

NGINX Plus MQTT Message Processing

NGINX Plus R29 supports MQTT 3.1.1 and MQTT 5.0. It acts as a proxy between clients and brokers, offloading tasks from core systems, simplifying scalability, and reducing compute costs. Specifically, NGINX Plus parses and rewrites portions of MQTT CONNECT messages, enabling features like:

  • MQTT broker load balancing 
  • Session persistence (reconnecting clients to the same broker) 
  • SSL/TLS termination 
  • Client certificate authentication 

MQTT message processing directives must be defined in the stream context of an NGINX configuration file and are provided by the ngx_stream_mqtt_preread_module
and ngx_stream_mqtt_filter_module.

The preread module processes MQTT data prior to NGINX’s internal proxying, allowing load balancing and upstream routing decisions to be made based on parsed message data.

The filter module enables rewriting of the clientid, username, and password fields within received CONNECT messages. The ability to set these fields to variables and complex values expands configuration options significantly, enabling NGINX Plus to mask sensitive device information or insert data like a TLS certificate distinguished name.

MQTT Directives and Variables

Several new directives and embedded variables are now available for tuning your NGINX configuration to optimize MQTT deployments and meet your specific needs.

Preread Module Directives and Embedded Variables

  • mqtt_preread – Enables MQTT parsing, extracting the clientid and username fields from CONNECT messages sent by client devices. These values are made available via embedded variables and help hash sessions to load balanced upstream servers (examples below).
  • $mqtt_preread_clientid – Represents the MQTT client identifier sent by the device.
  • $mqtt_preread_username – Represents the username sent by the client for authentication purposes.

Filter Module Directives

  • mqtt – Defines whether MQTT rewriting is enabled.
  • mqtt_buffers – Overrides the maximum number of MQTT processing buffers that can be allocated per connection and the size of each buffer. By default, NGINX will impose a limit of 100 buffers per connection, each 1k in length. Typically, this is optimal for performance, but may require tuning in special situations. For example, longer MQTT messages require a larger buffer size. Systems processing a larger volume of MQTT messages for a given connection within a short period of time may benefit from an increased number of buffers. In most cases, tuning buffer parameters has little bearing on underlying system performance, as NGINX constructs buffers from an internal memory pool.
  • mqtt_rewrite_buffer_size – Specifies the size of the buffer used for constructing MQTT messages. This directive has been deprecated and is obsolete since NGINX Plus R30.
  • mqtt_set_connect – Rewrites parameters of the CONNECT message sent from a client. Supported parameters include: clientid, username, and password.

MQTT Examples

Let’s explore the benefits of processing MQTT messages with NGINX Plus and the associated best practices in more detail. Note that we use ports 1883 and 8883 in the examples below. Port 1883 is the default unsecured MQTT port, while 8883 is the default SSL/TLS encrypted port.

MQTT Broker Load Balancing

The ephemeral nature of MQTT devices may cause client IPs to change unexpectedly. This can create challenges when routing device connections to the correct upstream broker. The subsequent movement of device connections from one upstream broker to another can result in expensive syncing operations between brokers, adding latency and cost.

By parsing the clientid field in an MQTT CONNECT message, NGINX can establish sticky sessions to upstream service brokers. This is achieved by using the clientid as a hash key for maintaining connections to broker services on the backend.

In this example, we proxy MQTT device data using the clientid as a token for establishing sticky sessions to three upstream brokers. We use the consistent parameter so that if an upstream server fails, its share of the traffic is evenly distributed across the remaining servers without affecting sessions that are already established on those servers.

stream {
      mqtt_preread on; 
     
      upstream backend {
          zone tcp_mem 64k;
          hash $mqtt_preread_clientid consistent;
    
          server 10.0.0.7:1883; # upstream mqtt broker 1
          server 10.0.0.8:1883; # upstream mqtt broker 2
          server 10.0.0.9:1883; # upstream mqtt broker 3 
      }
    
      server {
          listen 1883;
          proxy_pass backend;
          proxy_connect_timeout 1s;
      }
  }

NGINX Plus can also parse the username field of an MQTT CONNECT message. For more details, see the ngx_stream_mqtt_preread_module specification

SSL/TLS Termination

Encrypting device communications is key to ensuring data confidentiality and protecting against man-in-the-middle attacks. However, TLS handshaking, encryption, and decryption can be a resource burden on an MQTT broker. To solve this, NGINX Plus can offload data encryption from a broker (or a cluster of brokers), simplifying security rules and allowing brokers to focus on processing device messages. 

In this example, we show how NGINX can be used to proxy TLS-encrypted MQTT traffic from devices to a backend broker. The ssl_session_cache directive defines a 5-megabyte cache, which is enough to store approximately 20,000 SSL sessions. NGINX will attempt to reach the proxied broker for five seconds before timing out, as defined by the proxy_connect_timeout directive.

stream {
      server {
          listen 8883 ssl;
          ssl_certificate /etc/nginx/certs/tls-cert.crt;
          ssl_certificate_key /etc/nginx/certs/tls-key.key;
          ssl_session_cache shared:SSL:5m;
          proxy_pass 10.0.0.8:1883;
          proxy_connect_timeout 5s;
      }
  } 

Client ID Substitution

For security reasons, you may opt to not store client-identifiable information in the MQTT broker’s database. For example, a device may send a serial number or other sensitive data as part of an MQTT CONNECT message. By replacing a device’s identifier with other known static values received from a client, an alternate unique key can be established for every device attempting to reach NGINX Plus proxied brokers.

In this example, we extract a unique identifier from a device’s client SSL certificate and use it to mask its MQTT client ID. Client certificate authentication (mutual TLS) is controlled with the ssl_verify_client directive. When set to the on parameter, NGINX ensures that client certificates are signed by a trusted Certificate Authority (CA). The list of trusted CA certificates is defined by the ssl_client_certificate directive. 

stream {
      mqtt on; 
    
      server {
          listen 8883 ssl;
          ssl_certificate /etc/nginx/certs/tls-cert.crt;
          ssl_certificate_key /etc/nginx/certs/tls-key.key;
          ssl_client_certificate /etc/nginx/certs/client-ca.crt;
          ssl_session_cache shared:SSL:10m;
          ssl_verify_client on;
          proxy_pass 10.0.0.8:1883;
          proxy_connect_timeout 1s;
          
          mqtt_set_connect clientid $ssl_client_serial;
      }
  }

Client Certificate as an Authentication Credential

One common approach to authenticating MQTT clients is to use data stored in a client certificate as the username. NGINX Plus can parse client certificates and rewrite the MQTT username field, offloading this task from backend brokers. In the following example, we extract the client certificate’s Subject Distinguished Name (Subject DN) and copy it to the username portion of an MQTT CONNECT message.

stream {
      mqtt on; 
     
      server {
          listen 8883 ssl;
          ssl_certificate /etc/nginx/certs/tls-cert.crt;
          ssl_certificate_key /etc/nginx/certs/tls-key.key;
          ssl_client_certificate /etc/nginx/certs/client-ca.crt;
          ssl_session_cache shared:SSL:10m;
          ssl_verify_client on;
          proxy_pass 10.0.0.8:1883;
          proxy_connect_timeout 1s;
          
          mqtt_set_connect username $ssl_client_s_dn;
      }
  } 

For a complete specification on NGINX Plus MQTT CONNECT message rewriting, see the ngx_stream_mqtt_filter_module specification.

Get Started Today

Future developments to MQTT in NGINX Plus may include parsing of other MQTT message types, as well as deeper parsing of the CONNECT message to enable functions like:

  • Additional authentication and access control mechanisms
  • Protecting brokers by rate limiting “chatty” clients
  • Message telemetry and connection metrics

If you’re new to NGINX Plus, sign up for a free 30-day trial to get started with MQTT. We would also love to hear your feedback on the features that matter most to you. Let us know what you think in the comments.

How to Scan Your Environment for NGINX Instances

As the core module of F5 NGINX Management Suite, Instance Manager is an invaluable resource that enables you to locate, manage, and monitor all your NGINX Open Source and NGINX Plus instances easily and efficiently. Keeping track of NGINX instances is now simple with Instance Manager – the easy-to-use interface allows organizations to conveniently monitor all instances from a single pane of glass.

Instance Manager can also identify instances affected by Common Vulnerabilities and Exposures (CVEs) and instances with potentially expired SSL certificates. This wide scanning capability is crucial to ensure the security and safety of your Information Technology (IT) assets. The module also notifies when a new version exists to help resolve these vulnerabilities, making it essential for anyone who wants to proactively manage and secure NGINX instances.

With Instance Manager, you can be certain that your assets are being precisely tracked – leading to better management and enhanced overall security.

How NGINX Management Suite Instance Manager Works

Instance Manager makes it easy to scan your environment for NGINX instances by identifying active hosts using the Internet Control Message Protocol (ICMP).

Two primary methods can be used to identify active hosts:

  1. Enabling ICMP
  2. Disabling ICMP

To scan for an instance, navigate to the scan page and provide the IP address along with the port number. This process is straightforward and can be accomplished by following the steps provided on the scan page.

Overview of a NGINX scan when ICMP is enabled
Figure 1.  Overview of a NGINX scan when ICMP is enabled

To identify active hosts, you first verify port accessibility using ICMP Hello packets and then perform a TCP handshake. To detect NGINX, analyze the HTTP header of the server.

Note: If HTTP is enabled in NGINX Plus, your scan may reveal any CVE vulnerabilities. However, disabling HTTP on NGINX Plus could potentially affect the accuracy of this approach. If you choose to disable it, your scan will not be able to identify any CVEs. Therefore, it is recommended to keep HTTP enabled on NGINX Plus to achieve the most comprehensive and effective results in identifying active hosts.

Wireshark capture of when ICMP is enabled
Figure 2. Wireshark capture of when ICMP is enabled

When ICMP is disabled, you can ensure the proper functioning of a port by verifying it through the TCP handshake method. This method assesses the port’s response and confirms that the port is working as expected. If the SYN request is answered, Instance Manager can determine if the port is running NGINX or if the certificate has expired.

Note: If the SYN request goes unanswered, the process may be delayed and can potentially cause port exhaustion issues.

Overview of a NGINX scan when ICMP is disabled
Figure 3. Overview of a NGINX scan when ICMP is disabled

Instance Manager has the capability to check the SSL certificate date of any server, whether or not it is part of NGINX servers. The module conducts a comprehensive evaluation of each server’s SSL certificate date to identify any potential expirations. Scans done by Instance Manager cover all requested ports, alert you of any expired SSL certificates, and provide valuable insights to help keep your enterprise safe.

Wireshark capture when ICMP is disabled
Figure 4. Wireshark capture when ICMP is disabled

Lastly, implementing role-based access control (RBAC) affords you complete control over who can initiate a scan and who has granted access to your scan results. With this feature, your sensitive information remains confidential and secure, as only authorized personnel can access the results.

Additional Resources

Complete documentation on NGINX Management Suite Instance Manager can be found here.

If you are interested in exploring Instance Manager today, you can reach out to us to discuss your specific use cases.

Find and Fix API Endpoint Issues with Akita’s NGINX Plus Certified Module

If you’re responsible for a production service with any number of users, you likely understand the pain of customers finding issues before you do. At Akita, we want to solve this problem – which is why we built our new NGINX Plus Certified Module.

In this blog, we’ll cover key aspects of the module, including the reason to zoom out from logs, ways to quickly find and fix issues across your system, and how the new Akita modulemakes this functionality easily available to NGINX users.

Zooming Out From Logs to API Endpoints

Today, countless developers find themselves in an unfortunate situation where their customers have effectively become their monitoring system.

It’s not that software teams aren’t logging errors. For instance, if you use NGINX as your reverse proxy, you receive all kinds of information in your NGINX logs: timestamps, request lengths and processing time, and response status code. If you have the time and patience to look for it, the information is there.

However, in systems with many different requests and responses, it’s easy to get lost in the sea of logs! Unless you’ve proactively set up dashboards or another type of tool atop the logs, you may find yourself wading through thousands – if not millions – of log lines, trying to identify potential problems and where they started. But setting up the right dashboarding and monitoring methods can take weeks, months, or even quarters. And it often needs to be updated in tandem with code.

At Akita, we believe it’s crucial to zoom out from logs to API endpoints. This enables software teams to quickly see an overview of issues and hot spots while maintaining the granularity needed to actually identify the problem. We’re solving information overload in monitoring with a fully drop-in metrics solution that automatically monitors latency metrics and errors – no code changes or building dashboards necessary. Our solution passively watches API traffic and automatically analyzes it to provide per-endpoint monitoring and alerts. Best of all: Users can get started within 15 minutes of signing up.

Introducing Akita’s NGINX Plus Certified Module

We’re excited to introduce the Akita module, now available to NGINX users. If you’re using NGINX as your web application server, reverse proxy, or API gateway, you can now send your API traffic to Akita for analysis. Sign up for a free Akita account, install the Akita module and agent, and make a small change to your NGINX configuration file.

Within minutes, you’ll be able to navigate to the Akita console to see your API endpoints, what’s acting slow, and what’s throwing errors.

Akita console overview

Akita’s NGINX Plus Certified Module gives NGINX users the many benefits of Akita as an extension of your existing NGINX setup. Akita will capture your traffic from an HTTP request and measure its latency and errors while showing you what’s going on in production with pre-built dashboards.

How Akita’s NGINX Plus Certified Module Works

Let’s dive into the module’s functionality and where it comes into play. First, requests are processed by NGINX in multiple “phases”, starting with reading the request from the network, progressing through rewrites and access control checks, and ending with generating the response and any log entries. Akita’s NGINX Plus Certified Module inserts itself late in this process (in the pre-content phase, after features like header rewriting) so it can see the request in the form most similar to what the application receives. Akita checks each incoming request to see if it’s flagged for monitoring, based on the server and location in the NGINX configuration.

Note: Just like other NGINX features and modules, you can enable Akita for just part of your web service or have it default to everything NGINX serves.

In the next phase, the module records the request body and sends it to the Akita agent as soon as the request has been fully received. This behavior is similar to the ngx_http_mirror module, as the same data goes to both the application and Akita agent in parallel.

When NGINX or an upstream server has a response ready, the Akita module records this response (up to 1MB) while it streams back to the client. The response is not delayed by this buffering, which takes place in a NGINX “content filter” that can process each chunk of the response body as it becomes available.

Once the server response time is known and the response is successful, this response is then mirrored to the Akita agent. The agent matches the request and response together, then attempts to parse the request and response body content. This data is obfuscated locally by the agent before being sent to Akita for analysis. This means Akita sees the structure of your API traffic but not the specific values being sent by or to your users.

Akita’s NGINX Plus Certified Module automatically infers your endpoints from this trace of application traffic, building a browsable, downloadable model of your API and automatically displaying latency and error information. It allows you to alert on the rate of per-endpoint errors, high latency for a specific endpoint, or even an unexpectedly high volume of calls.

For each endpoint, Akita’s NGINX Plus Certified Module enables you to see:

  • The number of API calls
  • HTTP response code distribution
  • How long it took for your server to respond

More information about setting up Akita’s NGINX Plus Certified Module can be found here.

Get Started with Akita’s NGINX Plus Certified Module

Akita is currently in open beta. You can sign up for the beta and get results in less than 30 minutes.

The Mission-Critical Patient-Care Use Case That Became a Kubernetes Odyssey

Downtime can lead to serious consequences.

These words are truer for companies in the medical technology field than in most other industries – in their case, the "serious consequences" can literally include death. We recently had the chance to dissect the tech stack of a company that’s seeking to transform medical record keeping from pen-and-paper to secure digital data that is accessible anytime, and anywhere, in the world. These data range from patient information to care directives, biological markers, medical analytics, historical records, and everything else shared between healthcare teams.

From the outset, the company has sought to address a seemingly simple question: “How can we help care workers easily record data in real time?” As the company has grown, however, the need to scale and make data constantly available has made solving that challenge increasingly complex. Here we describe how the company’s tech journey has led them to adopt Kubernetes and NGINX Ingress Controller.

Tech Stack at a Glance

Here’s a look at where NGINX fits into their architecture:

Diagram how NGINX fits into their architecture

The Problem with Paper

Capturing patient status and care information at regular intervals is a core duty for healthcare personnel. Traditionally, they have recorded patient information on paper, or more recently on laptop or tablet. There are a couple serious downsides:

  • Healthcare workers may interact dozens of patients per day, so it’s usually not practical to write detailed notes while providing care. As a result, workers end up writing their notes at the end of their shift. At that point, mental and physical fatigue make it tempting to record only generic comments.
  • The workers must also depend on their memory of details about patient behavior. Inaccuracies might mask patterns that facilitate diagnosis of larger health issues if documented correctly and consistently over time.
  • Paper records can’t easily be shared among departments within a single department, let alone with other entities like EMTs, emergency room staff, and insurance companies. The situation isn’t much better with laptops or tablets if they’re not connected to a central data store or the cloud.

To address these challenges, the company created a simplified data recording system that provides shortcuts for accessing patient information and recording common events like dispensing medication. This ease of access and use makes it possible to record patient interactions in real time as they happen.

All data is stored in cloud systems maintained by the company, and the app integrates with other electronic medical records systems to provide a comprehensive longitudinal view of resident behaviors. This helps caregivers provide better continuity of care, creates a secure historical record, and can be easily shared with other healthcare software systems.

Physicians and other specialists also use the platform when admitting or otherwise engaging with patients. There’s a record of preferences and personal needs that travel with the patient to any facility. These can be used to help patients feel comfortable in a new setting, which improve outcomes like recovery time.

There are strict legal requirements about how long companies must store patient data. The company’s developers have built the software to offer extremely high availability with uptime SLAs that are much better than those of generic cloud applications. Keeping an ambulance waiting because a patient’s file won’t load isn’t an option.

The Voyage from the Garage to the Cloud to Kubernetes

Like many startups, the company initially saved money by running the first proof-of-concept application on a server in a co-founder’s home. Once it became clear the idea had legs, the company moved its infrastructure to the cloud rather than manage hardware in a data center. Being a Microsoft shop, they chose Azure. The initial architecture ran applications on traditional virtual machines (VMs) in Azure App Service, a managed application delivery service that runs Microsoft’s IIS web server. For data storage and retrieval, the company opted to use Microsoft’s SQL Server running in a VM as a managed application.

After several years running in the cloud, the company was growing quickly and experiencing scaling pains. It needed to scale infinitely, and horizontally rather than vertically because the latter is slow and expensive with VMs. This requirement led rather naturally to containerization and Kubernetes as a possible solution. A further point in favor of containerization was that the company’s developers need to ship updates to the application and infrastructure frequently, without risking outages. With patient notes being constantly added across multiple time zones, there is no natural downtime to push changes to production without the risk of customers immediately being affected by glitches.

A logical starting point for the company was Microsoft’s managed Kubernetes offering, Azure Kubernetes Services (AKS). The team researched Kubernetes best practices and realized they needed an Ingress controller running in front of their Kubernetes clusters to effectively manage traffic and applications running in nodes and pods on AKS.

Traffic Routing Must Be Flexible Yet Precise

The team tested AKS’s default Ingress controller, but found its traffic-routing features simply could not deliver updates to the company’s customers in the required manner. When it comes to patient care, there’s no room for ambiguity or conflicting information – it’s unacceptable for one care worker to see an orange flag and another a red flag for the same event, for example. Hence, all users in a given organization must use the same version of the app. This presents a big challenge when it comes to upgrades. There’s no natural time to transition a customer to a new version, so the company needed a way to use rules at the server and network level to route different customers to different app versions.

To achieve this, the company runs the same backend platform for all users in an organization and does not offer multi-tenancy with segmentation at the infrastructure layer within the organization. With Kubernetes, it is possible to split traffic using virtual network routes and cookies on browsers along with detailed traffic rules. However, the company’s technical team found that AKS’s default Ingress controller can split traffic only on a percentage basis, not with rules that operate at level of customer organization or individual user as required.

In its basic configuration, the NGINX Ingress Controller based on NGINX Open Source has the same limitation, so the company decided to pivot to the more advanced NGINX Ingress Controller based on NGINX Plus, an enterprise-grade product which supports granular traffic control. Finding recommendations from NGINX Ingress Controller from Microsoft and the Kubernetes community based on the high level of flexibility and control helped solidify the choice. The configuration better supports the company’s need for pod management (as opposed to classic traffic management), ensuring that pods are running in the appropriate zones and traffic is routed to those services. Sometimes traffic is being routed internally but in most use cases, it is routed back out through NGINX Ingress Controller for observability reasons.

Here Be Dragons: Monitoring, Observability and Application Performance

With NGINX Ingress Controller, the technical team has complete control over the developer and end user experience. Once users log in and establish a session, they can immediately be routed to a new version or reverted back to an older one. Patches can be pushed simultaneously and nearly instantaneously to all users in an organization. The software isn’t reliant on DNS propagation or updates on networking across the cloud platform.

NGINX Ingress Controller also meets the company’s requirement for granular and continuous monitoring. Application performance is extremely important in healthcare. Latency or downtime can hamper successful clinical care, especially in life-or-death situations. After the move to Kubernetes, customers started reporting downtime that the company hadn’t noticed. The company soon discovered the source of the problem: Azure App Service relies on sampled data. Sampling is fine for averages and broad trends, but it completely misses things like rejected requests and missing resources. Nor does it show the usage spikes that commonly occur every half hour as care givers check in and log patient data. The company was getting only an incomplete picture of latency, error sources, bad requests, and unavailable service.

The problems didn’t stop there. By default Azure App Service preserves stored data for only a month – far short of the dozens of years mandated by laws in many countries.  Expanding the data store as required for longer preservation was prohibitively expensive. In addition, the Azure solution cannot see inside of the Kubernetes networking stack. NGINX Ingress Controller can monitor both infrastructure and application parameters as it handles Layer 4 and Layer 7 traffic.

For performance monitoring and observability, the company chose a Prometheus time-series database attached to a Grafana visualization engine and dashboard. Integration with Prometheus and Grafana is pre-baked into the NGINX data and control plane; the technical team had to make only a small configuration change to direct all traffic through the Prometheus and Grafana servers. The information was also routed into a Grafana Loki logging database to make it easier to analyze logs and give the software team more control over data over time. 

This configuration also future-proofs against incidents requiring extremely frequent and high-volume data sampling for troubleshooting and fixing bugs. Addressing these types of incidents might be costly with the application monitoring systems provided by most large cloud companies, but the cost and overhead of Prometheus, Grafana, and Loki in this use case are minimal. All three are stable open source products which generally require little more than patching after initial tuning.

Stay the Course: A Focus on High Availability and Security

The company has always had a dual focus, on security to protect one of the most sensitive types of data there is, and on high availability to ensure the app is available whenever it’s needed. In the shift to Kubernetes, they made a few changes to augment both capacities.

For the highest availability, the technical team deploys an active-active, multi-zone, and multi-geo distributed infrastructure design for complete redundancy with no single point of failure. The team maintains N+2 active-active infrastructure with dual Kubernetes clusters in two different geographies. Within each geography, the software spans multiple data centers to reduce downtime risk, providing coverage in case of any failures at any layer in the infrastructure. Affinity and anti-affinity rules can instantly reroute users and traffic to up-and-running pods to prevent service interruptions. 

For security, the team deploys a web application firewall (WAF) to guard against bad requests and malicious actors. Protection against the OWASP Top 10 is table stakes provided by most WAFs. As they created the app, the team researched a number of WAFs including the native Azure WAF and ModSecurity. In the end, the team chose NGINX App Protect with its inline WAF and distributed denial-of-service (DDoS) protection.

A big advantage of NGINX App Protect is its colocation with NGINX Ingress Controller, which both eliminates a point of redundancy and reduces latency. Other WAFs must be placed outside of the Kubernetes environment, contributing to latency and cost. Even miniscule delays (say 1 millisecond extra per request) add up quickly over time.

Surprise Side Quest: No Downtime for Developers

Having completed the transition to AKS for most of its application and networking infrastructure, the company has also realized significant improvements to its developer experience (DevEx). Developers now almost always spot problems before customers notice any issues themselves. Since the switch, the volume of support calls about errors is down about 80%!

The company’s security and application-performance teams have a detailed Grafana dashboard and unified alerting, eliminating the need to check multiple systems or implement triggers for warning texts and calls coming from different processes. The development and DevOps teams can now ship code and infrastructure updates daily or even multiple times per day and use extremely granular blue-green patterns. Formerly, they were shipping updates once or twice per week and having to time there for low-usage windows, a stressful proposition. Now, code is shipped when ready and the developers can monitor the impact directly by observing application behavior.

The results are positive all around – an increase in software development velocity, improvement in developer morale, and more lives saved.

Announcing NGINX Plus R29

We’re happy to announce the availability of NGINX Plus Release 29 (R29). Based on NGINX Open Source, NGINX Plus is the only all-in-one software web server, load balancer, reverse proxy, content cache, and API gateway.
New and enhanced features in NGINX Plus R29 include:

  • Support for MQTT protocol– Message Queuing Telemetry Transport (MQTT) is a lightweight protocol used for communication between devices in the Internet of Things (IoT). NGINX Plus R29 supports the MQTT protocol with Preread and Filter modules that introduce multiple new directives and variables to help manage and secure MQTT traffic.
  • SAML support for authentication and authorization – Security Assertion Markup Language (SAML) is a well-established protocol that provides single sign-on (SSO) to web applications. NGINX Plus can now be configured as a SAML service provider (SP) to authenticate users against a SAML identity provider (IdP).
  • Native OpenTelemetry – OpenTelemetry (OTel) is a framework that generates, collects, and exports telemetry data (traces, metrics, and logs) from remote sources in a vendor-agnostic way. The new NGINX OTel dynamic module provides a high-performance OTel implementation for NGINX Plus HTTP request tracing.
  • Experimental QUIC+HTTP/3 packages – Preview packages of NGINX Plus R29 with QUIC+HTTP/3 are now available. The NGINX Plus R29 QUIC packages provide support for HttpContext and a range of new directives to manage QUIC connections and HTTP/3 traffic.

Important Changes in Behavior

Note: If you are upgrading from a release other than NGINX Plus R28, be sure to check the Important Changes in Behavior section in previous announcement blogs for all releases between your current version and this one.

Changes to Packaging Repository

The old package repository plus-pkgs.nginx.com is immediately decommissioned with the release of NGINX Plus R29. This repository has not been updated since NGINX Plus R25 and you are strongly advised to use the pkgs.nginx.com package repository that was introduced in NGINX Plus R24.

Changes to Platform Support

New operating systems supported:

  • Amazon Linux 2023

Older operating systems removed:

  • Alpine 3.13, which reached end-of-life (EOL) on November 1, 2022

Older operating systems deprecated and scheduled for removal in NGINX Plus R30:

  • Ubuntu 18.04, which will reach EOL in June 2023
  • Alpine 3.14, which will reach EOL in May 2023

Adapting to the ModSecurity End-of-Life Announcement

In line with the ModSecurity EOL announcement, NGINX Plus R29 removes support of ModSecurity packages. If you are a NGINX Plus customer using ModSecurity packages, you will soon be able to opt-in to a trade-in program between ModSecurity and NGINX App Protect. Details on this will be available soon and you can reach out to your contact at F5 for more information.

New Features in Detail

Support for MQTT Protocol

MQTT (Message Queuing Telemetry Transport) is a popular and lightweight publish-subscribe messaging protocol, ideal for connecting IoT devices and applications (clients) over the internet. It allows clients to publish messages to a specific topic and subscribe to other topics. Subscribed clients receive all messages published to that topic, enabling efficient and fault-tolerant data exchange between many devices and services.

At the heart of an MQTT architecture is a broker. A broker is a server responsible for tracking clients and any topics they’re subscribed to, processing messages, and routing those messages to appropriate systems. NGINX Plus R29 supports MQTT 3.1.1 and MQTT 5.0. It acts as a proxy between clients and brokers, which simplifies system architecture, offloads tasks, and reduces costs.

The initial MQTT feature set enables:

  • MQTT broker load balancing
  • Session persistence (reconnecting clients to the same broker)
  • TLS termination
  • Client certificate authentication
  • CONNECT message parsing and rewriting

The MQTT protocol defines several message types, including CONNECT, PUBLISH, and SUBSCRIBE. NGINX Plus R29 can actively parse and rewrite portions of MQTT CONNECT messages, enabling configuration scenarios previously only possible with custom scripts.

MQTT message parsing and rewriting must be defined in the Stream context of an NGINX configuration file and is made possible with the ngx_stream_mqtt_preread_module
and ngx_stream_mqtt_filter_module modules.

MQTT Examples

Modifying the default client identifier sent by an MQTT device enables NGINX to hide sensitive information, such as a device’s serial number. In this first example, the identifier is rewritten to the device’s IP address.

Note: Using a device’s IP address as the MQTT client identifier is not recommended in a production environment.

stream {
      mqtt on;
    server {         listen 1883;         proxy_pass 10.0.0.8:1883;         mqtt_set_connect clientid '$remote_addr';     } }

Given the ephemeral nature of MQTT clients, you can’t simply rely on a device’s hostname or IP address for establishing sticky sessions to load balanced brokers. In this example, a device’s MQTT client identifier acts as a hash key for persisting connections to individual MQTT brokers in a load balanced cluster:

stream {
      mqtt_preread on;
    upstream brokers{         zone tcp_mem 64k;         hash $mqtt_preread_clientid consistent;
        server 10.0.0.7:1883; # mqtt broker 1         server 10.0.0.8:1883; # mqtt broker 2         server 10.0.0.9:1883; # mqtt broker 3     }
    server {         listen 1883;         proxy_pass brokers;         proxy_connect_timeout 1s;     } }

Next Steps

Future developments to MQTT in NGINX Plus may include parsing of other MQTT message types, as well as deeper parsing of the CONNECT message to enable functions like:

  • Additional authentication and access control mechanisms
  • Protecting brokers by rate limiting “chatty” clients
  • Message telemetry and connection metrics

We would love to hear your feedback on the features that matter most to you. Let us know what you think in the comments.

SAML Support for Authentication and Authorization

SAML (Security Assertion Markup Language) is an open federation standard that allows an identity provider (IdP) to authenticate users for access to a resource (ensuring the end user is, in fact, who they claim to be) and to pass that authentication information, along with the user’s access rights on that resource, to a service provider (SP) for authorization.

With a long track record of providing a secure means to exchange identity data, SAML is a widely adopted protocol for exchanging authentication and authorization information between an IdP and SP.

Key reasons enterprises and government institutions choose to adopt SAML include:

  • Effective management of a large volume of identities
  • Enhanced, consistent, and unified identity security to customers and employees
  • Improved operational efficiencies via standardizing identity management processes
  • Efficient handling of regulatory compliances

 
SAML also provides several benefits:

  • Better User Experience: With its SSO integration and single point of authentication verification at the IdP, SAML enables users to have one authentication that accesses all connected services. This improves user experience and saves time because users no longer need to remember multiple credentials for various applications.
  • Increased Security: Depending on your organization’s security and authentication policies, users can log in using an SSO authentication scheme either at the SP interface (SP-initiated SSO) or directly at the IdP interface (IdP-initiated SSO). This reduces security risks due to potentially weak and/or repeating passwords.
  • Reduced Administrative Costs: SAML helps organizations offload the identity management responsibilities to a trusted IdP, thereby reducing the cost of maintaining account information and associated expenses.
  • Standardized Protocol: Designed with the principle of making security independent of application logic (as much as possible), SAML is a standardized protocol that is supported by almost all IdPs and access management systems. It abstracts the security framework away from platform architectures and particular vendor implementations, which enables robust security and reliable integration between systems.

The current reference implementation of SAML uses SAML 2.0 and is built using the NGINX JavaScript (njs) framework. In this implementation, NGINX Plus acts as a SAML SP, allowing it to participate in an SSO setup with a SAML IdP. The current implementation also depends on the key-value store, which is an existing NGINX Plus feature and, as such, is not suitable for NGINX Open Source without additional modifications.

SAML support in NGINX Plus is available as a reference implementation on GitHub. The GitHub repo includes a sample configuration with instructions on installation, configuration, and fine‑tuning for specific use cases.

Native OpenTelemetry

OpenTelemetry (OTel) is a technology and standard that can be used for monitoring, tracing, troubleshooting, and optimizing applications. OTel works by collecting telemetry data from various sources, such as proxies, applications, or other services in a deployed application stack.

As a protocol-aware reverse proxy and load balancer, NGINX is ideally positioned to initiate telemetry calls for tracing application requests and responses. While third-party OTel modules have been available for some time, we’re excited to announce native support for OTel in NGINX Plus with a new dynamic module.

The new module ngx_otel_module can be installed using the nginx-plus-module-otel package and provides several key improvements to third-party modules, including:

  • Better Performance – Most OTel implementations reduce performance of request processing by up to 50% when tracing is enabled. Our new native module limits this impact to around 10-15%.
  • Easy Provisioning – Setting up and configuring the telemetry collection can be done right in the NGINX configuration files.
  • Fully Dynamic Variable-Based Sampling – The ability to trace a particular session by cookie/token and control the module dynamically via the NGINX Plus API and key-value store modules.

More details about the OTel dynamic module are available in the NGINX documentation.

OTel Tracing Examples

Here is an example of basic OTel tracing of an application served directly by NGINX:

load_module modules/ngx_otel_module.so;
events {}
http {     otel_exporter {         endpoint localhost:4317;     }  
    server {         listen 127.0.0.1:8080;         
        otel_trace on;         otel_span_name app1;     } }

In this next example, we inherit trace contexts from incoming requests and record spans only if a parent span is sampled. We also propagate trace contexts and sampling decisions to upstream servers.

load_module modules/ngx_otel_module.so;
http {     server {         location / {             otel_trace $otel_parent_sampled;             otel_trace_context propagate;             proxy_pass http://backend;         }     } }

In this ratio-based example, tracing is configured for a percentage of traffic (in this case 10%):

http {
      # trace 10% of requests
      split_clients "$otel_trace_id" $ratio_sampler {
          10%     on;
          *       off;
      }
    # or we can trace 10% of user sessions
    split_clients "$cookie_sessionid" $session_sampler {         10%     on;         *       off;     }
    server {         location / {             otel_trace $ratio_sampler;             otel_trace_context inject;
            proxy_pass http://backend;         }     } }

In this API-controlled example, tracing is enabled by manipulating the key-value store via the /api endpoint:

http {
      keyval "otel.trace" $trace_switch zone=name;
    server {         location / {             otel_trace $trace_switch;             otel_trace_context inject;             proxy_pass http://backend;         }
        location /api {             api write=on;         }      } }

Experimental QUIC+HTTP/3 Packages

Following our announcement of preview binary packages for NGINX Open Source, we are pleased to announce experimental QUIC packages for NGINX Plus R29. This makes it possible to test and evaluate HTTP/3 with NGINX Plus.

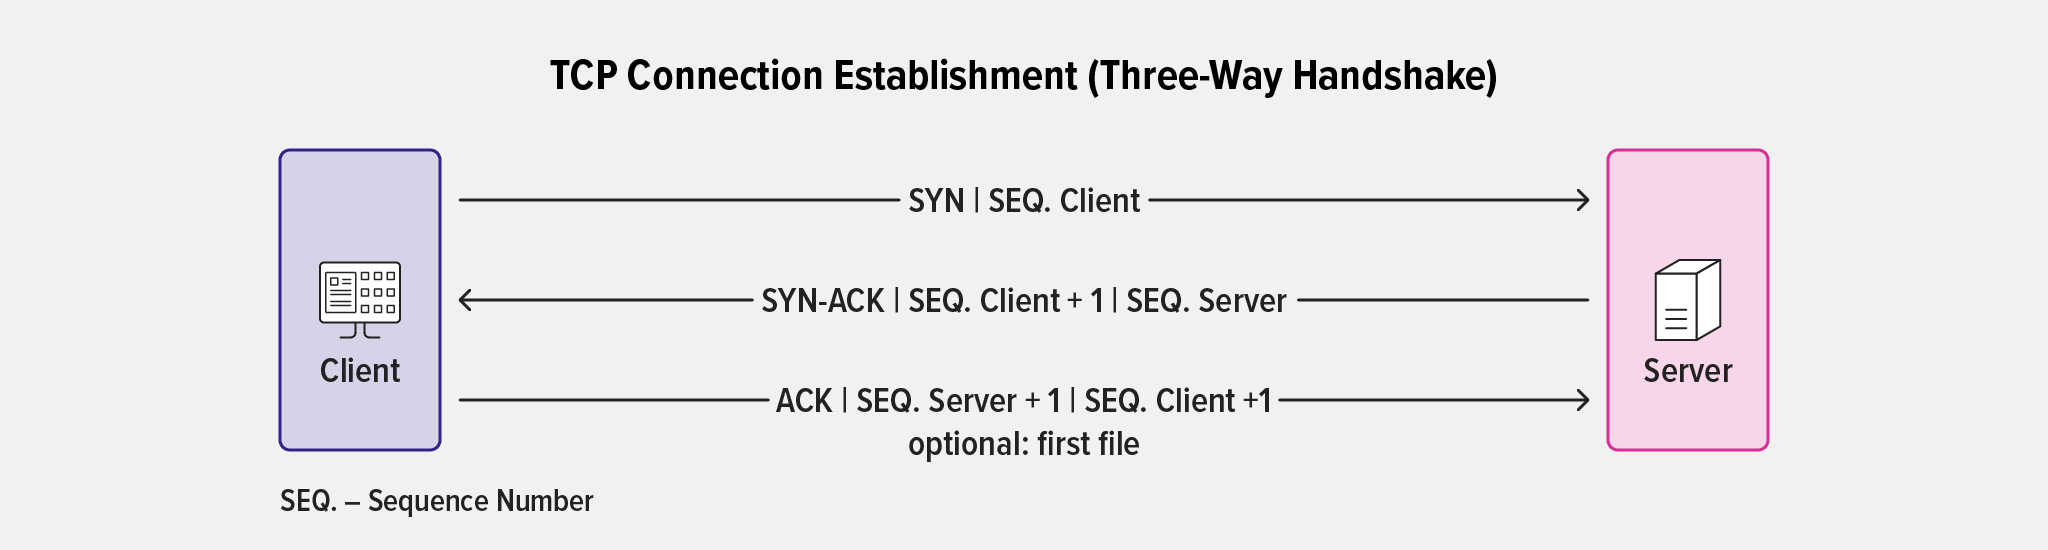
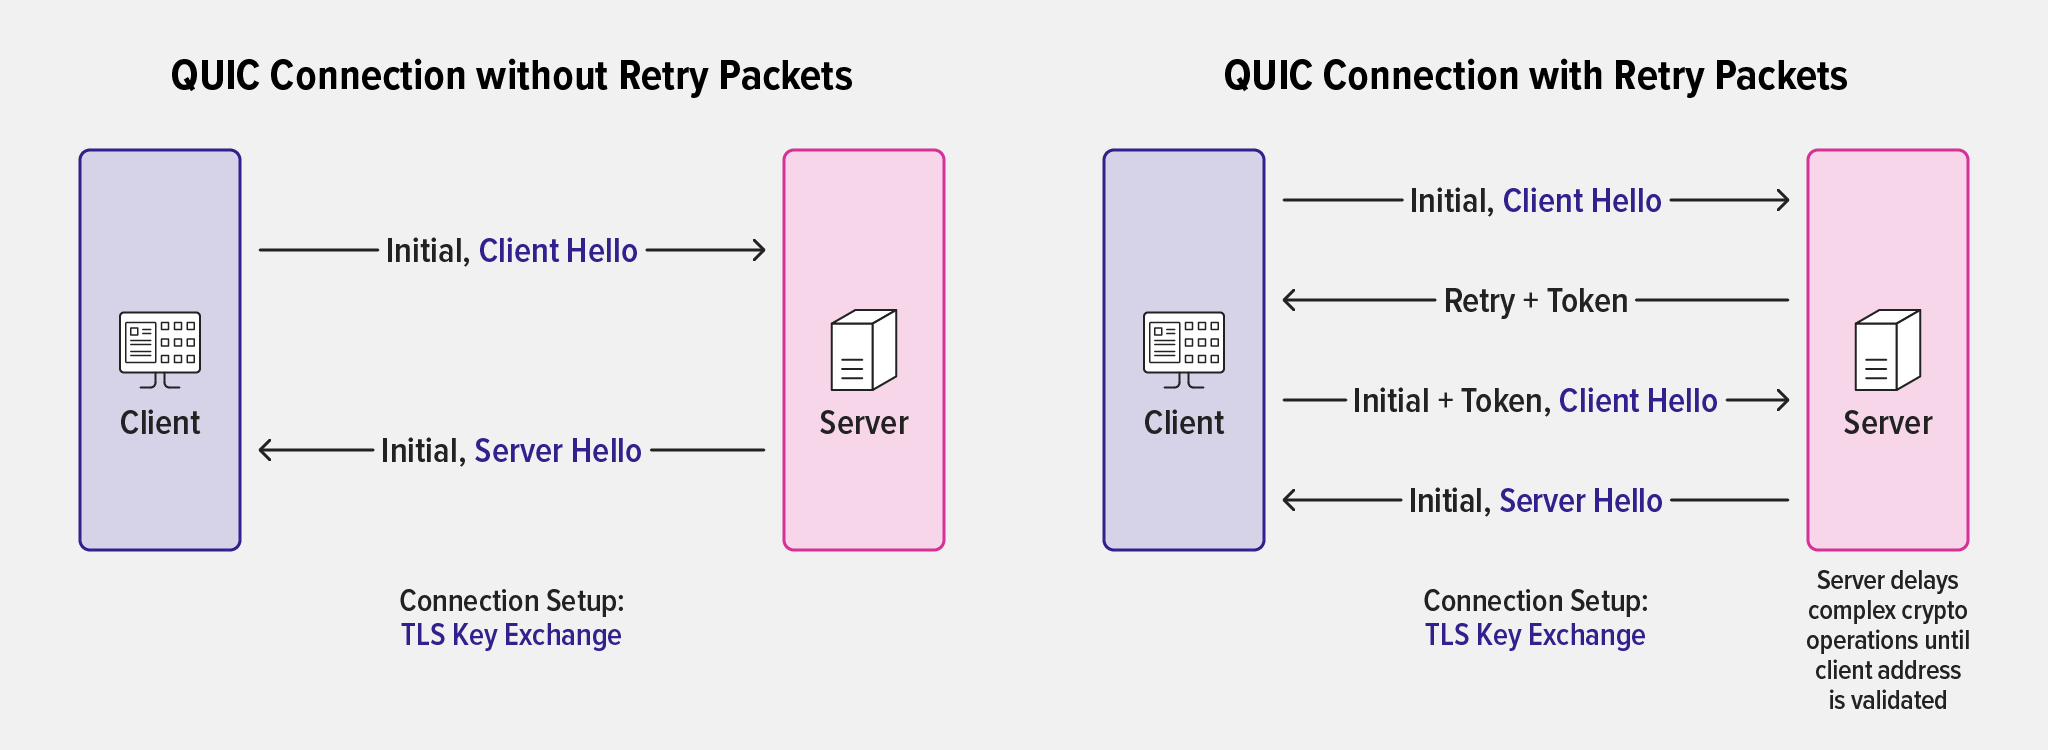
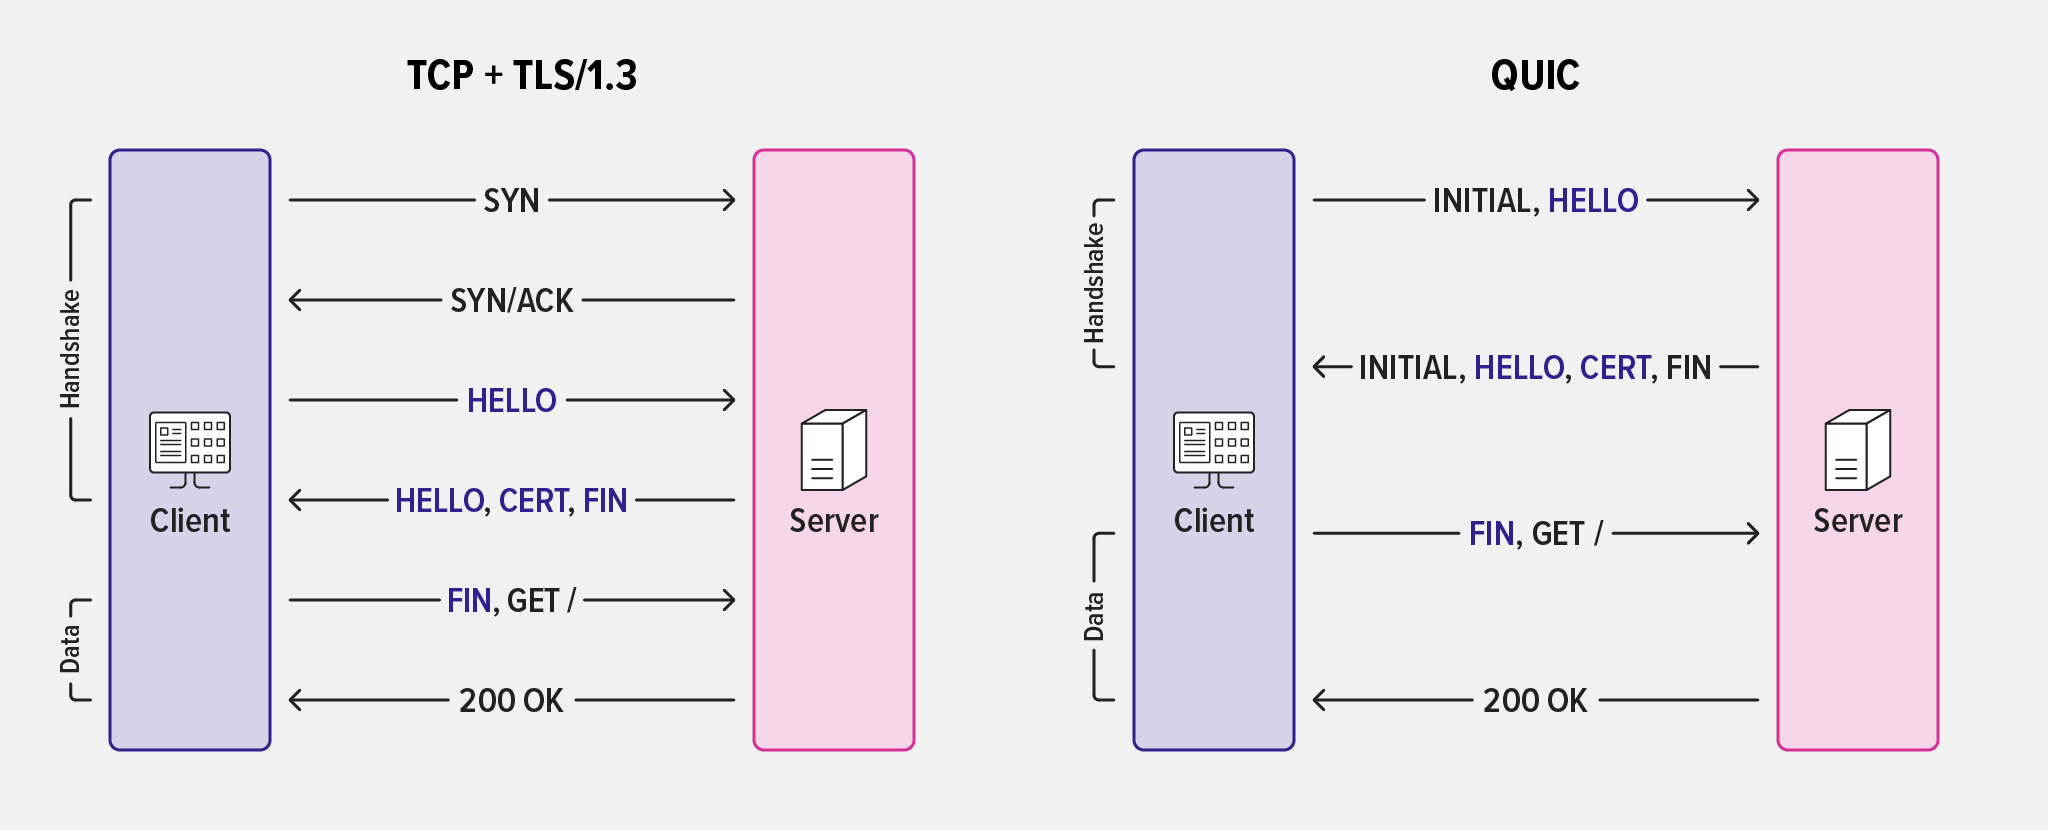
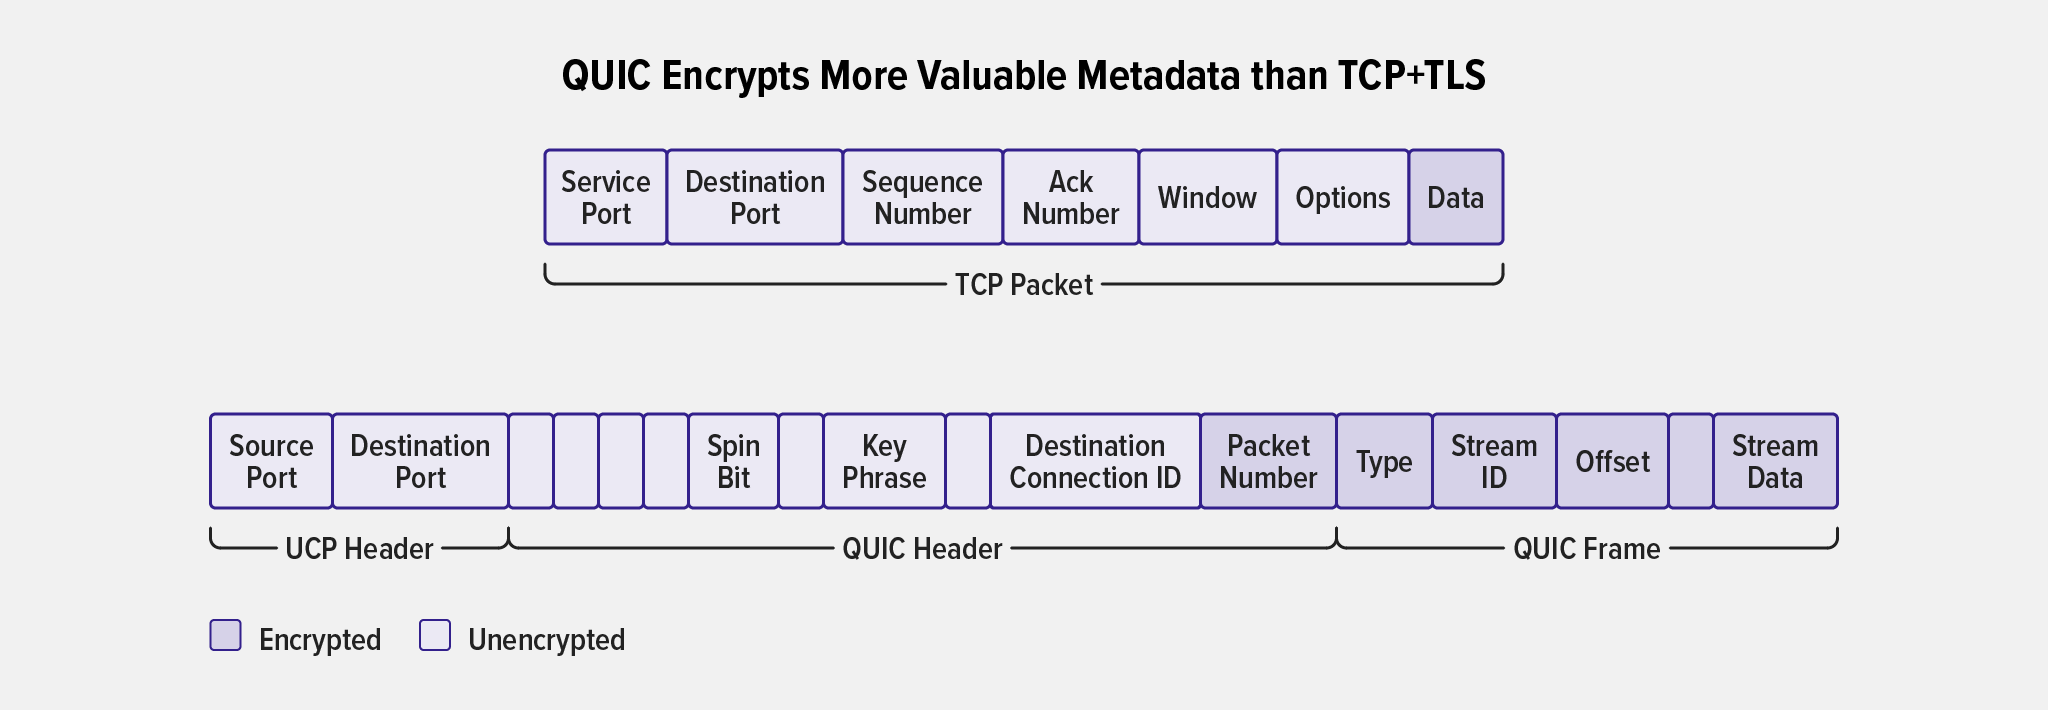
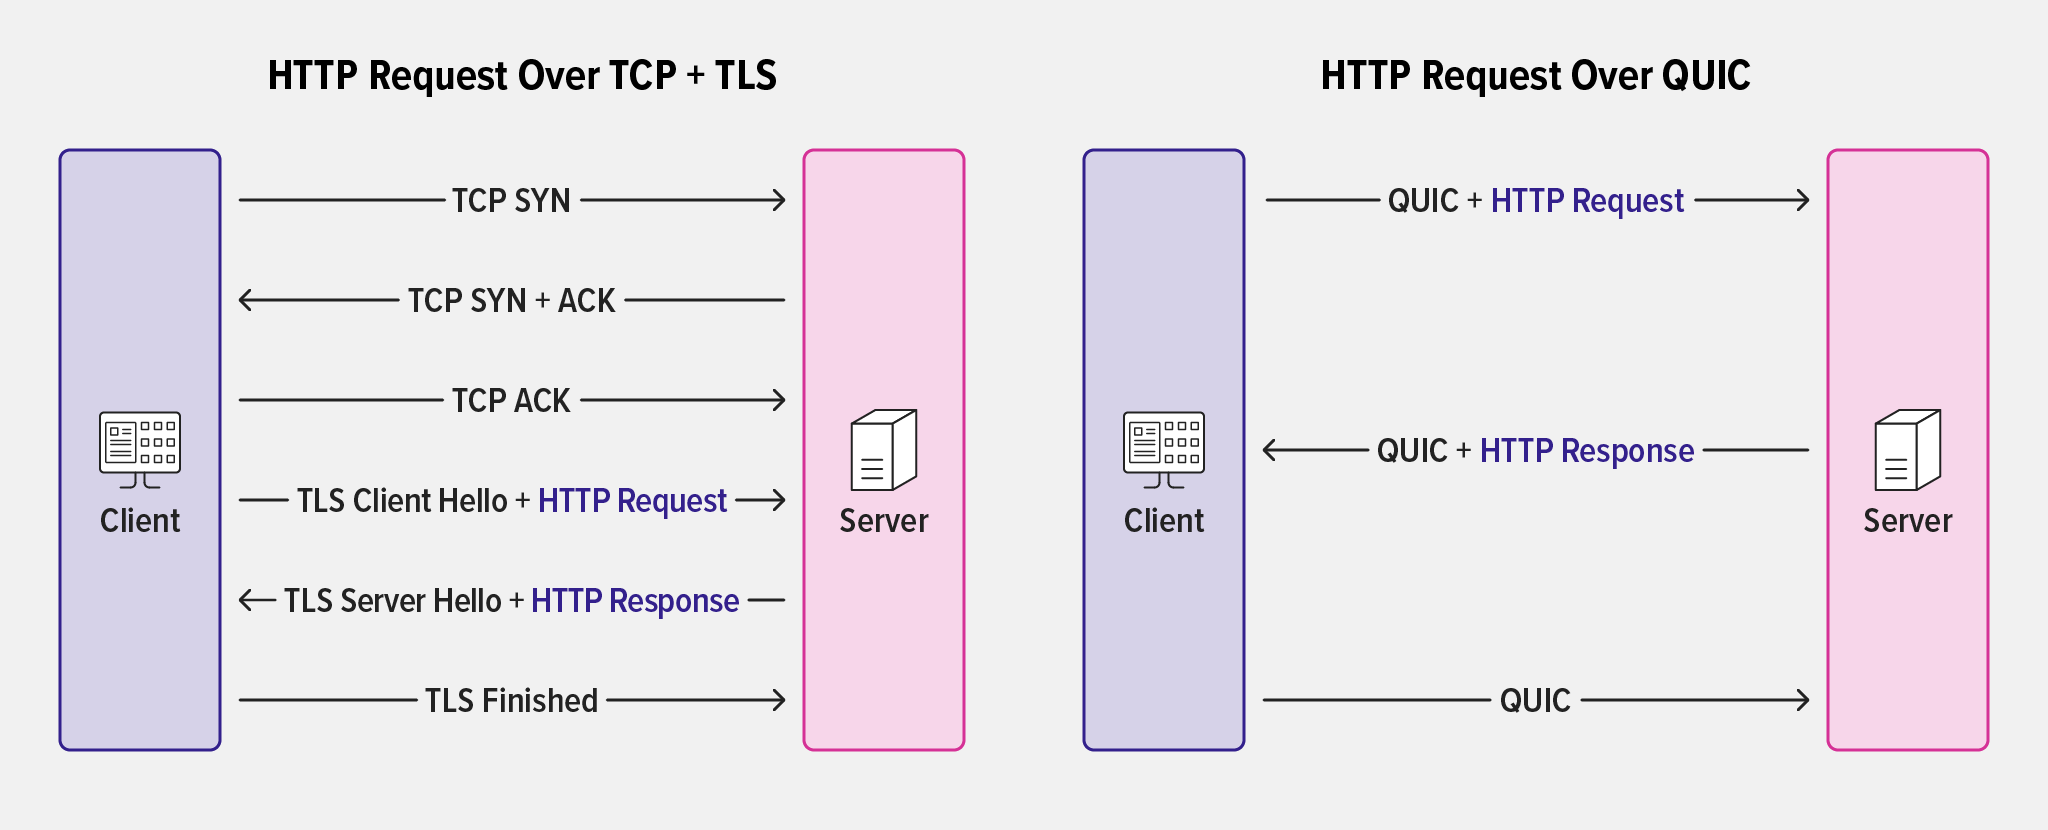
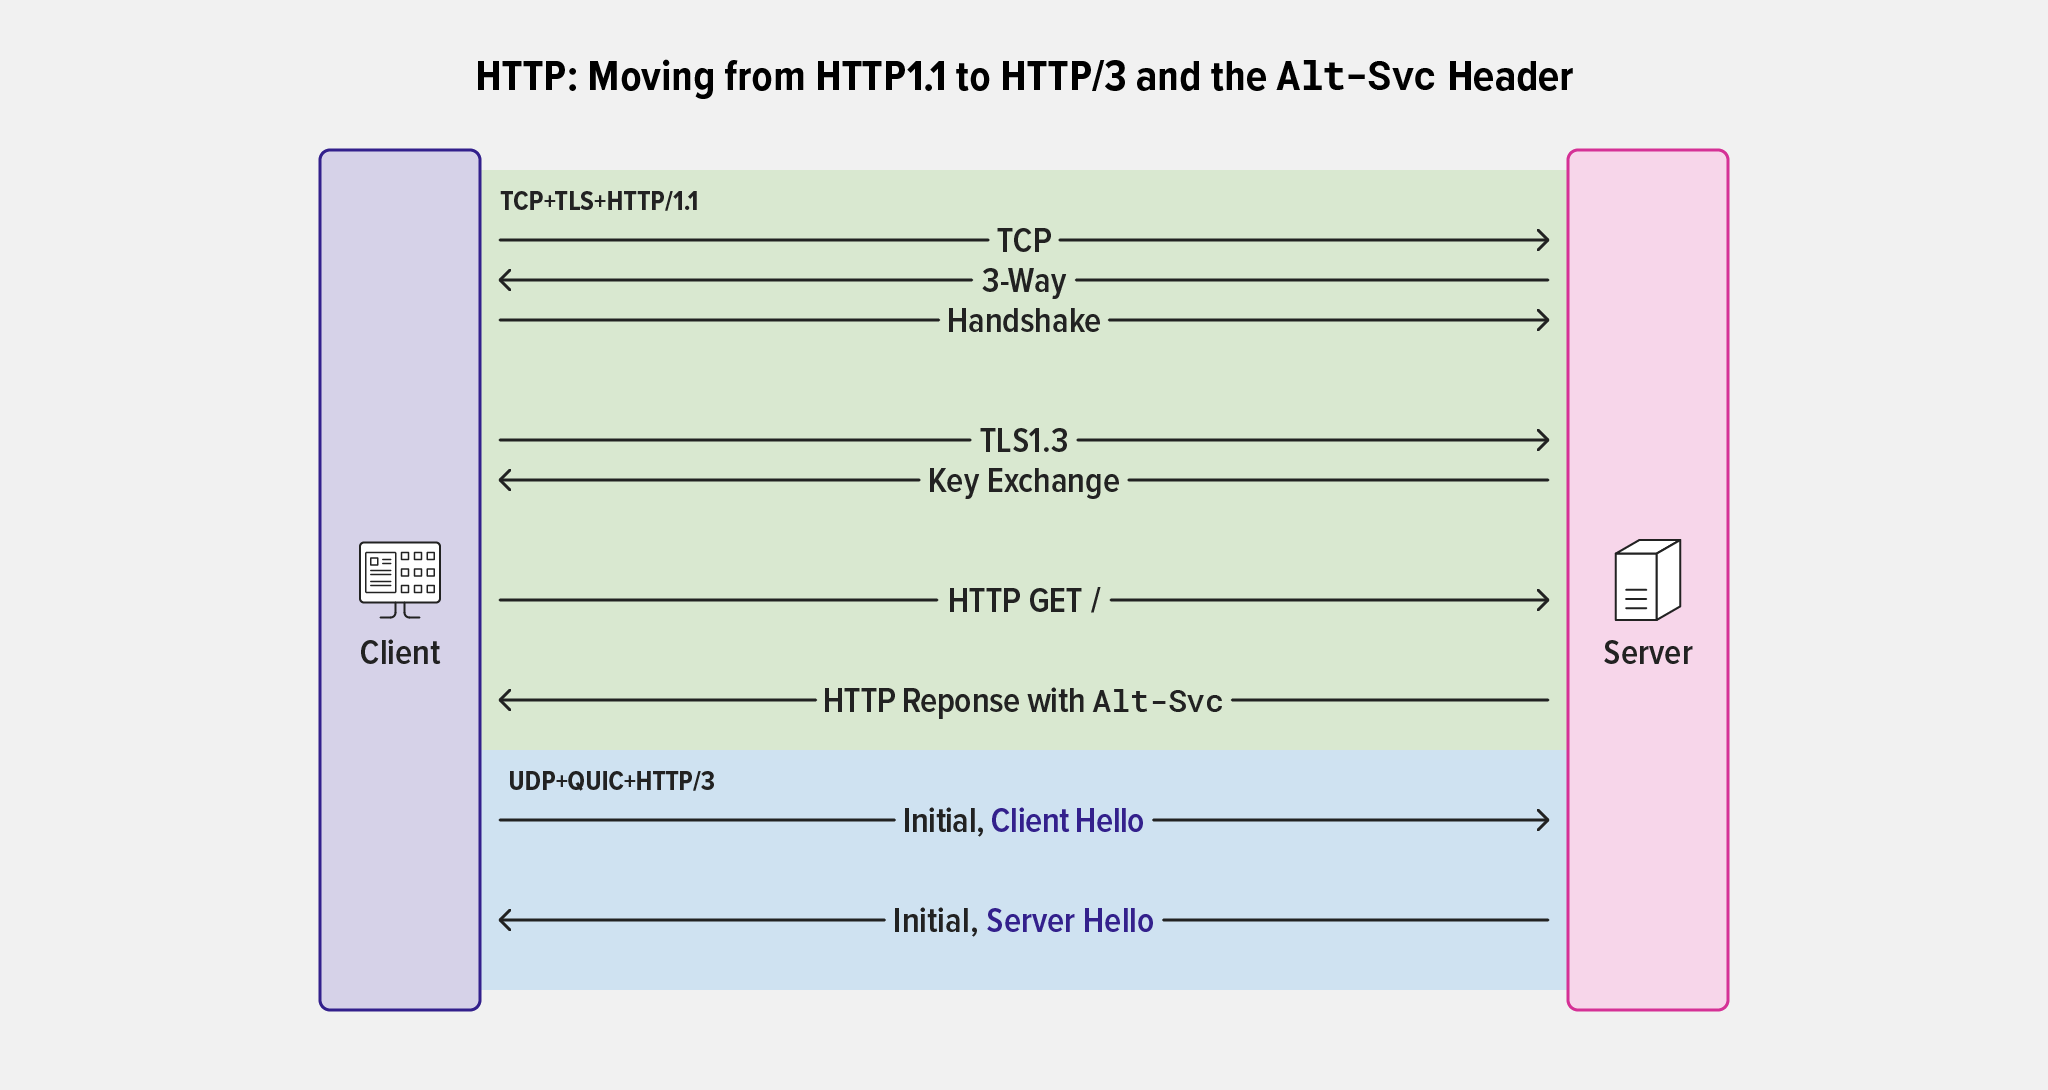
With a new underlying protocol stack, HTTP/3 brings UDP and QUIC to the transport layer. QUIC is an encrypted transport protocol designed to improve upon TCP by providing connection multiplexing and solving issues like head-of-line blocking. It reimplements and enhances a number of TCP capabilities from HTTP/1.1 and HTTP/2, including connection establishment, congestion control, and reliable delivery. QUIC also incorporates TLS as an integral component, unlike HTTP/1.1 and HTTP/2 which have TLS as a separate layer. This means HTTP/3 messages are inherently secure as they are sent over an encrypted connection by default.

Typically, for secure communication and cryptographic functionality, NGINX Plus relies on OpenSSL, making use of the SSL/TLS libraries that ship with operating systems. However, because QUIC’s TLS interfaces are not supported by OpenSSL at the time of this writing, third-party libraries are needed to provide for the missing TLS functionality required by HTTP/3.

To address this concern, we developed an OpenSSL Compatibility Layer for QUIC, removing the need to build and ship third-party TLS libraries like quictls, BoringSSL, and LibreSSL. This helps manage the end-to-end QUIC+HTTP/3 experience in NGINX without the burden of a custom TLS implementation nor the dependency on schedules and roadmaps of third-party libraries.

Note: The OpenSSL Compatibility Layer is included in the experimental NGINX Plus QUIC+HTTP/3 packages and requires OpenSSL 1.1.1 or above to provide TLSv1.3 (which is required by the QUIC protocol). It does not yet implement 0-RTT.

QUIC+HTTP/3 Sample Configuration

Let’s look at a sample configuration of QUIC+HTTP/3 in NGINX Plus:

http {
      log_format quic '$remote_addr - $remote_user [$time_local]'
      '"$request" $status $body_bytes_sent '
      '"$http_referer" "$http_user_agent" "$http3"';
    access_log logs/access.log quic;
    server {         # for better compatibility it's recommended         # to use the same port for quic and https         listen 8443 quic reuseport;         listen 8443 ssl;
        ssl_certificate     certs/example.com.crt;         ssl_certificate_key certs/example.com.key;
        location / {             # required for browsers to direct them into quic port             add_header Alt-Svc 'h3=":8443"; ma=86400';         }     } }

Similar to our implementation of HTTP/2, when NGINX Plus acts as a proxy, QUIC+HTTP/3 connections are made on the client side and converted to HTTP/1.1 when connecting to backend and upstream services.

The NGINX Plus QUIC+HTTP/3 experimental packages are available from a separate repository, accessible with existing NGINX Plus Certificates and Keys. Installation of the experimental QUIC packages is similar to a standard NGINX Plus installation. Please make sure to use the QUIC repo, as highlighted in the installation steps.

You can refer to Configuring NGINX for QUIC+HTTP/3 for more information on how to configure NGINX for QUIC+HTTP/3. For information about all the new directives and variables, see the Configuration section of the nginx-quic README.

Next Steps

In the near future, we plan to merge the QUIC+HTTP/3 code into the NGINX mainline branch. The latest version of NGINX mainline with QUIC+HTTP/3 support will then be merged into a following NGINX Plus release. Expect an announcement on the official availability of QUIC+HTTP/3 support in NGINX Plus later this year.

Other Enhancements in NGINX Plus R29

Changes to OpenID Connect

OpenID Connect (OIDC) support was introduced in NGINX Plus R15 and then significantly enhanced in subsequent versions. NGINX Plus R29 continues to enhance OIDC, with the following additions.

Support for Access Tokens

Access tokens are used in token-based authentication to allow an OIDC client to access a protected resource on behalf of the user. NGINX Plus receives an access token after a user successfully authenticates and authorizes access, and then stores it in the key-value store. NGINX Plus can pass that token on the HTTP Authorization header as a Bearer Token for every request that is sent to the downstream application.

Note: NGINX Plus does not verify the validity of the access token on each request (as it does with the ID token) and cannot know if the access token has already expired. If the access token’s lifetime is less than that of the ID token, you must use the proxy_intercept_errors on directive. This will intercept and redirect 401 Unauthorized responses to NGINX and refresh the access token.

For more information on OpenID Connect and JSON Web Token (JWT) validation with NGINX Plus, see Authenticating Users to Existing Applications with OpenID Connect and NGINX Plus.

Added Arguments in OIDC Authentication Endpoint

Some identity providers, like Keycloak, allow adding extra query string arguments to the authentication request to enable additional capabilities. For example, Keycloak allows a default IdP to be specified by adding a kc_idp_hint parameter to the authentication request. As part of this enhancement, the user can specify additional arguments to the OIDC authorization endpoint.

Extended SSL Counters in Prometheus-njs Module

In NGINX Plus R28, we added additional SSL counter support for handshake errors and certificate validation failures in both HTTP and Stream modules for client-side and server-side  connections. Our Prometheus-njs module, which converts NGINX Plus metrics to a Prometheus‑compliant format, now supports these counters.

New internal_redirect Directive

The new internal_redirect directive and module allows for internal redirects after checking request processing limits, connection processing limits, and access limits.

Here is an example internal_redirect configuration:

http {
      limit_req_zone $jwt_claim_sub zone=jwt_sub:10m rate=1r/s; 
    server {         location / {             auth_jwt "realm";             auth_jwt_key_file key.jwk;
            internal_redirect @rate_limited;         }
        location @rate_limited {             internal;             limit_req zone=jwt_sub burst=10;
         proxy_pass http://backend;         }     } }

In the example above, JWT authentication is performed at the location block and – if the token is valid – the request is passed to the internal content handler @rate_limited, where a request rate limit is applied based on sub claim value. This happens in the JWT before the request is passed to the upstream service.

This particular configuration prevents a denial-of-service (DoS) attack where an attacker sends a flood of requests containing readable JWTs, encoded with a particular user as the sub field. That flood of requests will not pass authentication but would count towards the rate limit. By authenticating the JWT before passing the request to the content handler, you ensure that only valid requests count towards the rate limit.

Changes Inherited from NGINX Open Source

NGINX Plus R29 is based on NGINX Open Source 1.23.4 and inherits functional changes and bug fixes made since NGINX Plus R28 was released (in NGINX 1.23.3 through 1.23.4).

Changes

  • The TLSv1.3 protocol is now enabled by default and is the default value for these directives:
  • NGINX now issues a warning if protocol parameters of a listening socket are redefined.
  • NGINX now closes connections with lingering if pipelining was used by the client.
  • The logging level of the data length too long, length too short, bad legacy version, no shared signature algorithms, bad digest length, missing sigalgs extension, encrypted length too long, bad length, bad key update, mixed handshake and non-handshake data, ccs received early, data between ccs and finished, packet length too long, too many warn alerts, record too small, and got a fin before a ccs SSL errors has been lowered from crit to info.

Features

  • Byte ranges are now supported in the ngx_http_gzip_static_module.

Bug Fixes

  • Fixed port ranges in the listen directive that did not work.
  • Fixed an incorrect location potentially being chosen to process a request if a prefix location longer than 255 characters was used in the configuration.
  • Fixed non-ASCII characters in file names on Windows, which were not supported by ngx_http_autoindex_module, ngx_http_dav_module, and the include directive.
  • Fixed a socket leak that sometimes occurred when using HTTP/2 and the error_page directive to redirect errors with code 400.
  • Fixed messages about logging to syslog errors, which did not contain information that the errors happened while logging to syslog.
  • Fixed handling of blocked client read events in proxy -r.
  • Fixed an error that sometimes occurred when reading the PROXY protocol version 2 header with large number of TLVs.
  • Fixed a segmentation fault that sometimes occurred in a worker process if SSI was used to process subrequests created by other modules.
  • Fixed NGINX potentially hogging CPU during unbuffered proxying if SSL connections to backends were used.

Workarounds

  • zip filter failed to use pre-allocated memory alerts appeared in logs when using zlib-ng.
  • When a hostname used in the listen directive resolves to multiple addresses, NGINX now ignores duplicates within these addresses.

For the full list of new features, changes, bug fixes, and workarounds inherited from these releases, see the CHANGES file.

Changes to the NGINX JavaScript Module

NGINX Plus R29 incorporates changes from the NGINX JavaScript (njs) module versions 0.7.9 to 0.7.12. Several exciting features were added to njs, including:

  • Extended Fetch API Support
  • Extended Web Crypto API
  • XML Document Support
  • XML Document Parsing
  • XMLNode API to Modify XML Documents
  • Zlib Module Compression Support

For a comprehensive list of all the features, changes, and bug fixes from njs version 0.7.9 to 0.7.12, see the njs Changes log.

Extended Fetch API Support

Headers(), Request(), and Response() constructors are added to the Fetch API, along with other enhancements:

async function makeRequest(uri, headers) {
      let h = new Headers(headers);
      h.delete("bar");
      h.append("foo", "xxx");
      let r = new Request(uri, {headers: h});
      return await ngx.fetch(r);
  }

Extended Web Crypto API

The Web Crypto API was extended to support the JSON Web Key (JWK) format and the importKey() now takes keys in JWK format as input:

async function importSigningJWK(jwk) {
     return await crypto.subtle.importKey('jwk', jwk,
                                          {name: "RSASSA-PKCS1-v1_5"},
                                          true, ['sign']);
  }

njs 0.7.10 also added the generateKey() and exportKey() methods. The generateKey() method allows you to generate a new key for symmetric algorithms or a key pair for public-key algorithms. The exportKey() method takes a CryptoKey object as input and returns the key in an external, portable format. It supports the JWK format to export the key as a JSON object.

For more details, refer Web Crypto API.

XML Document Support

The XML module was added in njs 0.7.10 to provide native support for working with XML documents.

XML Document Parsing

You can now parse a string or buffer for an XML document, which then returns an XMLDoc wrapper object representing the parsed XML document:

const xml = require("xml");
  let data = `<note><to b="bar" a= "foo">Tove</to><from>Jani</from></note>`;
  let doc = xml.parse(data);
   
console.log(doc.note.to.$text) /* 'Tove' */ console.log(doc.note.to.$attr$b) /* 'bar' */ console.log(doc.note.$tags[1].$text) /* 'Jani' */

XMLNode API to Modify XML Documents

The XMLNode API was added in njs 0.7.11 to modify XML documents:

Const xml = require("xml");
  let data = `<note><to b="bar" a="foo">Tove</to><from>Jani</from></note>`;
  let doc = xml.parse(data);
   
doc.$root.to.$attr$b = 'bar2'; doc.$root.to.setAttribute('c', 'baz'); delete doc.$root.to.$attr$a;  
console.log(xml.serializeToString(doc.$root.to)) /* '<to b="bar2" c="baz">Tove</to>' */  
doc.$root.to.removeAllAttributes(); doc.$root.from.$text = 'Jani2';  
console.log(xml.serializeToString(doc)) /* '<note><to>Tove</to><from>Jani2</from></note>' */  
doc.$root.to.$tags = [xml.parse(`<a/>`), xml.parse(`<b/>`)]; doc.$root.to.addChild(xml.parse(`<a/>`));
console.log(xml.serializeToString(doc.$root.to)) /* '<to><a></a><b></b><a></a></to>' */  
doc.$root.to.removeChildren('a');  
console.log(xml.serializeToString(doc.$root.to)) /* '<to><b></b></to>' */

For more details on all XML related enhancements, refer to the XML documents.

Zlib Module Compression Support

The zlib module was added in njs 0.7.12 and provides compression functionality using the deflate and inflate algorithms.

Const zlib = require('zlib');
  zlib.deflateRawSync('αβγ').toString('base64')
  /* "O7fx3KzzmwE=" */
   
zlib.inflateRawSync(Buffer.from('O7fx3KzzmwE=', 'base64')).toString() /* "αβγ" */

For more details on zlib, refer to the zlib documents.

Upgrade or Try NGINX Plus

If you’re running NGINX Plus, we strongly encourage you to upgrade to NGINX Plus R29 as soon as possible. In addition to all the great new features, you’ll also pick up several additional fixes and improvements, and being up to date will help NGINX to help you if you need to raise a support ticket.

If you haven’t tried NGINX Plus, we encourage you to try it out – for security, load balancing, and API gateway, or as a fully supported web server with enhanced monitoring and management APIs. Get started today with a free 30-day trial.

Secure Your GraphQL and gRPC Bidirectional Streaming APIs with F5 NGINX App Protect WAF

The digital economy continues to expand since the COVID-19 pandemic, with 90% of organizations growing their modern app architectures. In F5’s 2023 State of Application Strategy Report, more than 40% of the 1,000 global IT decision makers surveyed describe their app portfolios as "modern". This percentage has been growing steadily over the last few years and is projected to exceed 50% by 2025. However, the increase in modern apps and use of microservices is accompanied by a proliferation of APIs and API endpoints, exponentially increasing the potential for vulnerabilities and the surface area for attacks.

According to Continuous API Sprawl, a report from the F5 Office of the CTO, there were approximately 200 million APIs worldwide in 2021, a number expected to approach 2 billion by 2030.  Compounding the complexity resulting from this rapid API growth is the challenge of managing distributed applications across hybrid and multi-cloud environments. Respondents to the 2023 State of Application Strategy Report cited the complexity of managing multiple tools and APIs as their #1 challenge as they deploy apps in multi-cloud environments. Applying consistent security policies and optimizing app performance were tied in a close second place.

Poll results for challenges people currently have with deploying applications in multiple clouds. Complexity and security issues continue, while visibility— number 1 in 2022—fell to seventh.
Figure 1: Top challenges of deploying apps in a multi-cloud environment (source: 2023 State of Application Strategy Report).

Why API Security is Critical to Your Bottom line

Not only are APIs the building blocks of modern applications, they’re at the core of digital business – 58% of organizations surveyed in the F5 2023 report say they derive at least half of their revenue from digital services. APIs enable user-to-app and app-to-app communication, and the access they provide to private customer data and internal corporate information make them lucrative targets for attackers. APIs were the attack vector of choice in 2022.

Protecting APIs is paramount in an overall application security strategy. Attacks can have devastating consequences that go far beyond violating consumer privacy (bad as that is), to an increased level of severity that harms public safety and leads to loss of intellectual property. Here are some examples of each of these types of API attacks that occurred in 2022.

  • Consumer privacy – Twitter experienced a multi-year API attack. In December 2022, hackers stole the profile data and email addresses of 200 million Twitter users. Four months earlier, 3,207 mobile applications leaking valid Twitter API keys and secrets were discovered by CloudSEK researchers. And a month prior to that, hackers had exploited an API vulnerability to seize and sell data from 5.4 million users .
  • Public safety – A team of researchers found critical API security vulnerabilities across approximately 20 top automotive manufacturers, including Toyota, Mercedes, and BMW. With so many cars today acting like smart devices, hackers can go well beyond stealing VINs and personal information about car owners. They can track car locations and control the remote management system, allowing them to unlock and start the car or disable the car completely.
  • Intellectual property – A targeted employee at CircleCI, a CI/CD platform used by over 1 million developers worldwide to ship code, was the victim of a malware attack. This employee had privileges to generate production access tokens, and as a result hackers were able to steal customers’ API keys and secrets. The breach went unnoticed for nearly three weeks. Unable to tell whether a customer’s secrets were stolen and used for unauthorized access to third-party systems, CircleCI could only advise customers to rotate project and personal API tokens.

These API attacks serve as cautionary tales. When APIs have security vulnerabilities and are left unprotected, the longtail consequences can go far beyond monetary costs. The significance of API security cannot be overstated.

How F5 NGINX Helps You Secure Your APIs

The NGINX API Connectivity Stack solution helps you manage your API gateways and APIs across multi-cloud environments. By deploying NGINX Plus as your API gateway with NGINX App Protect WAF, you can help prevent and mitigate common API exploits that address the top three API challenges identified in the F5 2023 State of Application Strategy Report – managing API complexity across multi-cloud environments, ensuring security policies, and optimizing app performance – as well as the types of API attacks discussed in the previous section. NGINX Plus can be used in several ways, including as an API gateway where you can route API requests quickly, authenticate and authorize API clients to secure your APIs, and rate limit traffic to protect your API‑based services from overload.

NGINX Plus provides out-of-the-box protection against not only the OWASP API Security Top 10 vulnerabilities. It also checks for malformed cookies, JSON, and XML, validates allowed file types and response status codes, and detects evasion techniques used to mask attacks. A NGINX Plus API gateway ensures protection for HTTP or HTTP/2 API protocols including REST, GraphQL, and gRPC.

NGINX App Protect WAF provides lightweight, high-performance app and API security that goes beyond basic protection against the OWASP API Security Top 10 and OWASP (Application) Top 10, with protection from over 7,500 advanced signatures, bot signatures, and threat campaigns. It enables a shift-left strategy and easy automation of API security for integrating security-as-code into CI/CD pipelines. In testing against the AWS, Azure, and Cloudflare WAFs, NGINX App Protect WAF was found to deliver strong app and API security while maintaining better performance and lower latency. For more details, check out this GigaOm Report.  

NGINX App Protect WAF is embedded into the NGINX Plus API gateway, resulting in one less hop for API traffic. Fewer hops between layers reduces latency, complexity, and points of failure. This is in stark contrast with typical API-management solutions which do not integrate with a WAF (you must deploy the WAF separately and, once it is set up, API traffic must traverse the WAF and API gateway separately). NGINX’s tight integration means high performance without compromise on security.

GraphQL and gRPC Are on the Rise

App and API developers are constantly looking for new ways to increase flexibility, speed, and ease of use and deployment. According to the 2022 State of the API Report from Postman, REST is still the most popular API protocol used today (89%), but GraphQL (28%) and gRPC (11%) continue to grow in popularity. Ultimately the choice of API protocol is highly dependent on the purpose of application and the best solution for your business. Each protocol has its own benefits.

Why Use GraphQL APIs?

Key benefits of using GraphQL APIs include:

  • Adaptability – The client decides on the data request, type, and format.
  • Efficiency – There is no over-fetching, requests are run against a created schema, and the data returned is exactly (and only) what was requested. The formatting of data in request and response is identical, making GraphQL APIs fast, predictable, and easy to scale.
  • Flexibility – Supports over a dozen languages and platforms.

GitHub is one well-known user of GraphQL. They made the switch to GraphQL in 2016 for scalability and flexibility reasons.

Why Use gRPC APIs?

Key benefits of using gRPC APIs include:

  • Performance – The lightweight, compact data format minimizes resource demands and enables fast message encoding and decoding
  • Efficient – The protobufs data format streamlines communication by serializing structured data
  • Reliability – HTTP/2 and TLS/SSL are required, improving security by default

Most of the power comes from the client side, while management and computations are offloaded to a remote server hosting the resource. gRPC is suited for use cases that routinely need a set amount of data or processing, such as traffic between microservices or data collection in which the requester (such as an IOT device) needs to conserve limited resources.

Netflix is an example of a well know user of gRPC APIs.

Secure Your GraphQL APIs with NGINX App Protect WAF

NGINX App Protect WAF now supports GraphQL APIs in addition to REST and gRPC APIs. It secures GraphQL APIs by applying attack signatures, eliminating malicious exploits, and defending against attacks. GraphQL traffic is natively parsed, enabling NGINX App Protect WAF to detect violations based on GraphQL syntax and profile and apply attack signatures. Visibility into introspection queries enables NGINX App Protect WAF to block them, as well as block detected patterns in responses. This method helps to detect attacks and run signatures in the appropriate segments of a payload, and by doing so, helps to reduce false positives.
 
Learn how NGINX App Protect WAF can defend your GraphQL APIs from attacks in this demo.

Benefits of GraphQL API security with NGINX App Protect WAF:

  • Define security parameters – Set in accordance with your organizational policy the total length and value of parameters in the GraphQL template and content profile as part of the app security policy
  • Reduce false positives – Improve accuracy of attack prevention with granular controls for better detection of attacks in a GraphQL request
  • Alleviate malicious exploits – Define maximum batched queries in one HTTP request to reduce the risk of malicious exploitation and attacks
  • Eliminate DoS attacks – Configure maximum structure depth in content profiles to stop DoS attacks caused by recursive queries
  • Limit API risk exposure – Enforce constraints on introspection queries to prevent hackers from understanding the API structure, which can lead to a breach

Secure gRPC Bidirectional Streaming APIs with NGINX App Protect WAF

NGINX App Protect WAF now supports gRPC bidirectional streaming in addition to unary message types, enabling you to secure gRPC-based APIs that use message streams (client, server, or both). This provides complete security for gRPC APIs regardless of the communication type.

NGINX App Protect WAF secures gRPC APIs by enforcing your schema, setting size limits, blocking unknown files, and preventing resource-exhaustion types of DoS attacks. You can import your Interface Definition Language (IDL) file to NGINX App Protect WAF so that it can enforce the structure and schema of your gRPC messages and scan for attacks in the right places. This enables accurate detection of attempts to exploit your application through gRPC and avoids false positives that can occur when scanning for security in the wrong places without context.

Learn how NGINX App Protect WAF can defend your gRPC bidirectional APIs from attacks in this demo.

Benefits of gRPC API security with NGINX App Protect WAF:

  • Comprehensive gRPC protection – From unary to bidirectional streaming, complete security regardless of communication type
  • Reduce false positives – Improved accuracy from enforcement of gRPC message structure and schema, for better detection of attacks in a gRPC request
  • Block malicious exploits – Enforcement that each field in the gRPC message has the correct type and expected content, with the ability to block unknown fields
  • Eliminate DoS attacks – Message size limits to prevent resource-exhaustion types of DoS attacks

Both SecOps and API Dev Teams Can Manage and Automate API Security

In Postman’s 2022 State of the API Report, 20% of the 37,000 developers and API professionals surveyed stated that API incidents occur at least once a month at their organization, resulting in loss of data, loss of service, abuse, or inappropriate access. In contrast, 52% of respondents suffered an API attack less than once per year, underscoring the importance of incorporating security early as part of a shift-left strategy for API security. With APIs being published more frequently than applications, a shift left strategy is increasingly being applied to API security. When organizations adopt a shift-left culture and integrate security-as-code into CI/CD pipelines, they build security into each stage of API development, enable developers to remain agile, and accelerate deployment velocity.

Diagram showing how to shift left using security as code with NGINX App Protect WAF, Jenkins, and Ansible
Figure 2: NGINX App Protect WAF enables API security integration into CI/CD pipelines for automated protection that spans the entire API lifecycle.

A key area where protection must be API specific is the validation of API schemata, including gRPC IDL files and GraphQL queries. Schemata are unique to each API and change with each API version. When automating the API schema, any time you update an API you also need to update the configuration and code in that file. WAF configurations can be deployed in an automated fashion to keep up with API version changes. NGINX App Protect WAF can validate schemata, verifying that requests comply with what the API supports (methods, endpoints, parameters, and so on). NGINX App Protect WAF enables consistent app security with declarative policies that can be created by SecOps teams, with API Dev teams able to manage and deploy API security for more granular control and agility. If you are looking to automate your API security at scale across hybrid and multi-cloud environments, NGINX App Protect WAF can help.

Summary

Modern app portfolios continue to grow, and with the use of microservices comes an even greater proliferation of APIs. API security is complex and challenging, especially for organizations operating in hybrid or multi-cloud environments. Lack of API security can have devastating longtail effects beyond monetary costs. NGINX App Protect WAF provides comprehensive API security that includes protection for your REST, GraphQL, and gRPC APIs and helps your SecOps and API teams shift left and automate security throughout the entire API lifecycle and across distributed environments.

Test drive NGINX App Protect WAF today with a 30-day free trial.

Additional Resources

Blog: Secure Your API Gateway with NGINX App Protect WAF
eBook: Modern App and API Security
eBook: Mastering API Architecture from O’Reilly
Datasheet: NGINX App Protect WAF

A Primer on QUIC Networking and Encryption in NGINX

The first mention of QUIC and HTTP/3 on the NGINX blog was four years ago (!), and like you we’re now eagerly looking forward to the imminent merging of our QUIC implementation into the NGINX Open Source mainline branch. Given the long gestation, it’s understandable if you haven’t QUIC much thought.

At this point, however, as a developer or site administrator you need to be aware of how QUIC shifts responsibility for some networking details from the operating system to NGINX (and all HTTP apps). Even if networking is not your bag, adopting QUIC means that worrying about the network is now (at least a little bit) part of your job.

In this post, we dive into key networking and encryption concepts used in QUIC, simplifying some details and omitting non‑essential information in pursuit of clarity. While some nuance might be lost in the process, our intention is to provide enough information for you to effectively adopt QUIC in your environment, or at least a foundation on which to build your knowledge.

If QUIC is entirely new to you, we recommend that you first read one of our earlier posts and watch our overview video.

For a more detailed and complete explanation of QUIC, we recommend the excellent Manageability of the QUIC Transport Protocol document from the IETC QUIC working group, along with the additional materials linked throughout this document.

Why Should You Care About Networking and Encryption in QUIC?

The grimy details of network connection between clients and NGINX have not been particularly relevant for most users up to now. After all, with HTTP/1.x and HTTP/2 the operating system takes care of setting up the Transmission Control Protocol (TCP) connection between clients and NGINX. NGINX simply uses the connection once it’s established.

With QUIC, however, responsibility for connection creation, validation, and management shifts from the underlying operating system to NGINX. Instead of receiving an established TCP connection, NGINX now gets a stream of User Datagram Protocol (UDP) datagrams, which it must parse into client connections and streams. NGINX is also now responsible for dealing with packet loss, connection restarts, and congestion control.

Further, QUIC combines connection initiation, version negotiation, and encryption key exchange into a single connection‑establishment operation. And although TLS encryption is handled in a broadly similar way for both QUIC+HTTP/3 and TCP+HTTP/1+2, there are differences that might be significant to downstream devices like Layer 4 load balancers, firewalls, and security appliances.

Ultimately, the overall effect of these changes is a more secure, faster, and more reliable experience for users, with very little change to NGINX configuration or operations. NGINX administrators, however, need to understand at least a little of what’s going on with QUIC and NGINX, if only to keep their mean time to innocence as short as possible in the event of issues.

(It’s worth noting that while this post focuses on HTTP operations because HTTP/3 requires QUIC, QUIC can be used for other protocols as well. A good example is DNS over QUIC, as defined in RFC 9250, DNS over Dedicated QUIC Connections.)

With that introduction out of the way, let’s dive into some QUIC networking specifics.

TCP versus UDP

QUIC introduces a significant change to the underlying network protocol used to transmit HTTP application data between a client and server.

As mentioned, TCP has always been the protocol for transmitting HTTP web application data. TCP is designed to deliver data reliably over an IP network. It has a well‑defined and understood mechanism for establishing connections and acknowledging receipt of data, along with a variety of algorithms and techniques for managing the packet loss and delay that are common on unreliable and congested networks.

While TCP provides reliable transport, there are trade‑offs in terms of performance and latency. In addition, data encryption is not built into TCP and must be implemented separately. It has also been difficult to improve or extend TCP in the face of changing HTTP traffic patterns – because TCP processing is performed in the Linux kernel, any changes must be designed and tested carefully to avoid unanticipated effects on overall system performance and stability.

Another issue is that in many scenarios, HTTP traffic between client and server passes through multiple TCP processing devices, like firewalls or load balancers (collectively known as “middleboxes”), which may be slow to implement changes to TCP standards.

QUIC instead uses UDP as the transport protocol. UDP is designed to transmit data across an IP network like TCP, but it intentionally disposes of connection establishment and reliable delivery. This lack of overhead makes UDP suitable for a lot of applications where efficiency and speed are more important than reliability.

For most web applications, however, reliable data delivery is essential. Since the underlying UDP transport layer does not provide reliable data delivery, these functions need to be provided by QUIC (or the application itself). Fortunately, QUIC has a couple advantages over TCP in this regard:

  • QUIC processing is performed in Linux user space, where problems with a particular operation pose less risk to the overall system. This makes rapid development of new features more feasible.
  • The “middleboxes” mentioned above generally do minimal processing of UDP traffic, and so do not constrain enhancements to the QUIC protocol.

A Simplified QUIC Network Anatomy

QUIC streams are the logical objects containing HTTP/3 requests or responses (or any other application data). For transmission between network endpoints, they are wrapped inside multiple logical layers as depicted in the diagram.

Diagram showing components of a QUIC stream: a UDP datagram containing a header and multiple QUIC packets; the components in a QUIC packet (a header and frames); the components in a QUIC header; the components in a frame
Figure 1. Anatomy of a QUIC stream

Starting from the outside in, the logical layers and objects are:

  • UDP Datagram – Contains a header specifying the source and destination ports (along with length and checksum data), followed by one or more QUIC packets. The datagram is the unit of information transmitted from client to server across the network.
  • QUIC Packet – Contains one QUIC header and one or more QUIC frames.
  • QUIC Header – Contains metadata about the packet. There are two types of header:

    • The long header, used during connection establishment.
    • The short header, used after the connection is established. It contains (among other data) the connection ID, packet number, and key phase (used to track which keys were used to encrypt the packet, in support of key rotation). Packet numbers are unique (and always increase) for a particular connection and key phase.
  • Frame – Contains the type, stream ID, offset, and stream data. Stream data is spread across multiple frames, but can be assembled using the connection ID, stream ID, and offset, which is used to present the chunks of data in the correct order.
  • Stream – A unidirectional or bidirectional flow of data within a single QUIC connection. Each QUIC connection can support multiple independent streams, each with its own stream ID. If a QUIC packet containing some streams is lost, this does not affect the progress of any streams not contained in the missing packet (this is critical to avoiding the head-of-line blocking experienced by HTTP/2). Streams can be bidirectional and created by either endpoint.

Connection Establishment

The familiar SYN / SYN-ACK / ACK three‑way handshake establishes a TCP connection:

Diagram showing the three messages exchanged between client and server in the handshake to establish a TCP connection
Figure 2. The three-way handshake that establishes a TCP connection

Establishing a QUIC connection involves similar steps, but is more efficient. It also builds address validation into the connection setup as part of the cryptographic handshake. Address validation defends against traffic amplification attacks, in which a bad actor sends the server a packet with spoofed source address information for the intended attack victim. The attacker hopes the server will generate more or larger packets to the victim than the attacker can generate on its own, resulting in an overwhelming amount of traffic. (For more details, see Section 8 of RFC 9000, QUIC: A UDP‑Based Multiplexed and Secure Transport.)

As part of connection establishment, the client and server provide independent connection IDs which are encoded in the QUIC header, providing a simple identification of the connection, independent of the client source IP address.

However, as the initial establishment of a QUIC connection also includes operations for exchange of TLS encryption keys, it’s more computationally expensive for the server than the simple SYN-ACK response it generates during establishment of a TCP connection. It also creates a potential vector for distributed denial-of-service (DDoS) attacks, because the client IP address is not validated before the key‑exchange operations take place.

But you can configure NGINX to validate the client IP address before complex cryptographic operations begin, by setting the quic_retry directive to on. In this case NGINX sends the client a retry packet containing a token, which the client must include in connection‑setup packets.

Diagram showing the handshake for establishing a QUIC connection, without and with a replay packet
Figure 3. QUIC connection setup, without and with a retry packet

This mechanism is somewhat like the three‑way TCP handshake and, critically, establishes that the client owns the source IP address that it is presenting. Without this check in place, QUIC servers like NGINX might be vulnerable to easy DoS attacks with spoofed source IP addresses. (Another QUIC mechanism that mitigates such attacks is the requirement that all initial connection packets must be padded to a minimum of 1200 bytes, making sending them a more expensive operation.)

In addition, retry packets mitigate an attack similar to the TCP SYN flood attack (where server resources are exhausted by a huge number of opened but not completed handshakes stored in memory), by encoding details of the connection in the connection ID it sends to the client; this has the further benefit that no server‑side information need be retained, as connection information can be reconstituted from the connection ID and token subsequently presented by the client. This technique is analogous to TCP SYN cookies. In addition, QUIC servers like NGINX can supply an expiring token to be used in future connections from the client, to speed up connection resumption.

Using connection IDs enables the connection to be independent of the underlying transport layer, so that changes in networking need not cause connections to break. This is discussed in Gracefully Managing Client IP Address Changes.

Loss Detection

With a connection established (and encryption enabled, as discussed further below), HTTP requests and responses can flow back and forth between the client and NGINX. UDP datagrams are sent and received. However, there are many factors that might cause some of these datagrams to be lost or delayed.

TCP has complex mechanisms to acknowledge packet delivery, detect packet loss or delay, and manage the retransmission of lost packets, delivering properly sequenced and complete data to the application layer. UDP lacks this facility and therefore congestion control and loss detection are implemented in the QUIC layer.

  • Both client and server send an explicit acknowledgment for each QUIC packet they receive (although packets containing only low‑priority frames aren’t acknowledged immediately).
  • When a packet containing frames that require reliable delivery has not been acknowledged after a set timeout period, it is deemed lost.

    Timeout periods vary depending on what’s in the packet – for instance, the timeout is shorter for packets that are needed for establishing encryption and setting up the connection, because they are essential for QUIC handshake performance.

  • When a packet is deemed lost, the missing frames are retransmitted in a new packet, which has a new sequence number.
  • The packet recipient uses the stream ID and offset on packets to assemble the transmitted data in the correct order. The packet number dictates only the order of sending, not how packets should be assembled.
  • Because data assembly at the receiver is independent of transmission order, a lost or delayed packet affects only the individual streams it contains, not all streams in the connection. This eliminates the head-of-line blocking problem that affects HTTP/1.x and HTTP/2 because streams are not part of the transport layer.

A complete description of loss detection is beyond the scope of this primer. See RFC 9002, QUIC Loss Detection and Congestion Control, for details about the mechanisms for determining timeouts and how much unacknowledged data is allowed to be in transit.

Gracefully Managing Client IP Address Changes

A client’s IP address (referred to as the source IP address in the context of an application session) is subject to change during the session, for example when a VPN or gateway changes its public address or a smartphone user leaves a location covered by WiFi, which forces a switch to a cellular network. Also, network administrators have traditionally set lower timeouts for UDP traffic than for TCP connections, which results in increased likelihood of network address translation (NAT) rebinding.

QUIC provides two mechanisms to reduce the disruption that can result: a client can proactively inform the server that its address is going to change, and servers can gracefully handle an unplanned change in the client’s address. Since the connection ID remains consistent through the transition, unacknowledged frames can be retransmitted to the new IP address.

Changes to the source IP address during QUIC sessions may pose a problem for downstream load balancers (or other Layer 4 networking components) that use source IP address and port to determine which upstream server is to receive a particular UDP datagram. To ensure correct traffic management, providers of Layer 4 network devices will need to update them to handle QUIC connection IDs. To learn more about the future of load balancing and QUIC, see the IETF draft QUIC‑LB: Generating Routable QUIC Connection IDs.

Encryption

In Connection Establishment, we alluded to the fact that the initial QUIC handshake does more than simply establish a connection. Unlike the TLS handshake for TCP, with UDP the exchange of keys and TLS 1.3 encryption parameters occurs as part of the initial connection. This feature removes several exchanges and enables zero round‑trip time (0‑RTT) when the client resumes a previous connection.

Diagram comparing the encryption handshakes for TCP+TLS/1.3 and QUIC
Figure 4. Comparison of the encryption handshakes for TCP+TLS/1.3 and QUIC

In addition to folding the encryption handshake into the connection‑establishment process, QUIC encrypts a greater portion of the metadata than TCP+TLS. Even before key exchange has occurred, the initial connection packets are encrypted; though an eavesdropper can still derive the keys, it takes more effort than with unencrypted packets. This better protects data such as the Server Name Indicator (SNI) which is relevant to both attackers and potential state‑level censors. Figure 5 illustrates how QUIC encrypts more potentially sensitive metadata (in red) than TCP+TLS.

Diagram showing how much more data is encrypted in a QUIC datagram than in a TCP packet for HTTP/1 and HTTP/2
Figure 5. QUIC encrypts more sensitive metadata than TCP+TLS

All data in the QUIC payload is encrypted using TLS 1.3. There are two advantages: older, vulnerable cipher suites and hashing algorithms are not allowed and forward secrecy (FS) key‑exchange mechanisms are mandatory. Forward secrecy prevents an attacker from decrypting the data even if the attacker captures the private key and a copy of the traffic.

Low and Zero-RTT Connections Reduce Latency

Reducing the number of round trips that must happen between a client and server before any application data can be transmitted improves the performance of applications, particularly over networks with higher latency.

TLS 1.3 introduced a single round trip to establish an encrypted connection, and zero round trips to resume a connection, but with TCP this means the handshake has to occur before the TLS Client Hello.

Because QUIC combines cryptographic operations with connection setup, it provides true 0‑RTT connection re‑establishment, where a client can send a request in the very first QUIC packet. This reduces latency by eliminating the initial roundtrip for connection establishment before the first request.

Diagram showing that TCP+TLS requires 6 messages to re-establish a connection, and QUIC only 3
Figure 6. Comparison of the messages required to re-establish a connection with TCP+TLS versus QUIC

In this case, the client sends an HTTP request encrypted with the parameters used in a previous connection, and for address‑validation purposes includes a token supplied by the server during the previous connection.

Unfortunately, 0‑RTT connection resumption does not provide Forward Secrecy, so the initial client request is not as securely encrypted as other traffic in the exchange. Requests and responses beyond the first request are protected by Forward Secrecy. Possibly more problematic is that the initial request is also vulnerable to replay attacks, where an attacker can capture the initial request and replay it to the server multiple times.

For many applications and websites, the performance improvement from 0‑RTT connection resumption outweighs these potential vulnerabilities, but that’s a decision you need to make for yourself.

This feature is disabled by default in NGINX. To enable it, set the ssl_early_data directive to on.

Moving from HTTP/1.1 to HTTP/3 with the Alt-Svc Header

Nearly all clients (browsers in particular) make initial connections over TCP/TLS. If a server supports QUIC+HTTP/3, it signals that fact to the client by returning an HTTP/1.1 response that includes the h3 parameter to the Alt-Svc header. The client then chooses whether to use QUIC+HTTP/3 or stick with an earlier version of HTTP. (As a matter of interest, the Alt-Svc header, defined in RFC 7838, predates QUIC and can be used for other purposes as well.)

Diagram showing how the server uses the Alt-Svc header to signal to a client that it supports HTTP/3
Figure 7. How the Alt-Svc header is used to convert a connection from HTTP/1.1 to HTTP/3

The Alt-Svc header tells a client that the same service is available on an alternate host, protocol, or port (or a combination thereof). In addition, clients can be informed how long it’s safe to assume that this service will continue to be available.

Some examples:

Alt-Svc: h3=":443" HTTP/3 is available on this server on port 443
Alt-Svc: h3="new.example.com:8443" HTTP/3 is available on server new.example.com on port 8443
Alt-Svc: h3=":8443"; ma=600 HTTP/3 is available on this server on port 8443 and will be available for at least 10 minutes

Although not mandatory, in most cases servers are configured to respond to QUIC connections on the same port as TCP+TLS.

To configure NGINX to include the Alt-Svc header, use the add_header directive. In this example, the $server_port variable means that NGINX accepts QUIC connections on the port to which the client sent its TCP+TLS request, and 86,400 is 24 hours:

add_header Alt-Svc 'h3=":$server_port"; ma=86400';

Conclusion

This blog provides a simplified primer on QUIC, and hopefully gives you enough of an overview to understand key networking and encryption operations used with QUIC.

For a more comprehensive look at configuring NGINX for QUIC + HTTP/3 read Binary Packages Now Available for the Preview NGINX QUIC+HTTP/3 Implementation on our blog or watch our webinar, Get Hands‑On with NGINX and QUIC+HTTP/3. For details on all NGINX directives for QUIC+HTTP/3 and complete instructions for installing prebuilt binaries or building from source, see the NGINX QUIC webpage.

Building a Docker Image of NGINX Plus with NGINX Agent for Kubernetes

F5 NGINX Management Suite is a family of modules for managing the NGINX data plane from a single pane of glass. By simplifying management of NGINX Open Source and NGINX Plus instances, NGINX Management Suite simplifies your processes for scaling, securing, and monitoring applications and APIs.

You need to install the NGINX Agent on each NGINX instance you want to manage from NGINX Management Suite, to enable communication with the control plane and remote configuration management.

For NGINX instances running on bare metal or a virtual machine (VM), we provide installation instructions in our documentation. In this post we show how to build a Docker image for NGINX Plus and NGINX Agent, to broaden the reach of NGINX Management Suite to NGINX Plus instances deployed in Kubernetes or other microservices infrastructures.

There are three build options, depending on what you want to include in the resulting Docker image:

[Editor – This post was updated in April 2023 to clarify the instructions, and add the ACM_DEVPORTAL field, in Step 1 of Running the Docker Image in Kubernetes.]

Prerequisites

We provide a GitHub repository of the resources you need to create a Docker image of NGINX Plus and NGINX Agent, with support for version 2.8.0 and later of the Instance Manager module from NGINX Management Suite.

To build the Docker image, you need:

  • A Linux host (bare metal or VM)
  • Docker 20.10+
  • A private registry to which you can push the target Docker image
  • A running NGINX Management Suite instance with Instance Manager, and API Connectivity Manager if you want to leverage support for the developer portal
  • A subscription (or 30-day free trial) for NGINX Plus and optionally NGINX App Protect

To run the Docker image, you need:

  • A running Kubernetes cluster
  • kubectl with access to the Kubernetes cluster

Building the Docker Image

Follow these instructions to build the Docker image.

  1. Clone the GitHub repository:

    $ git clone https://github.com/nginxinc/NGINX-Demos 
    Cloning into 'NGINX-Demos'... 
    remote: Enumerating objects: 126, done. 
    remote: Counting objects: 100% (126/126), done. 
    remote: Compressing objects: 100% (85/85), done. 
    remote: Total 126 (delta 61), reused 102 (delta 37), pack-reused 0 
    Receiving objects: 100% (126/126), 20.44 KiB | 1.02 MiB/s, done. 
    Resolving deltas: 100% (61/61), done.
  2. Change to the build directory:

    $ cd NGINX-Demos/nginx-agent-docker/
  3. Run docker ps to verify that Docker is running and then run the build.sh script to include the desired software in the Docker image. The base options are:

    • ‑C – Name of the NGINX Plus license certificate file (nginx-repo.crt in the sample commands below)
    • ‑K – Name of the NGINX Plus license key file (nginx-repo.key in the sample commands below)
    • ‑t – The registry and target image in the form

      <registry_name>/<image_name>:<tag>

      (registry.ff.lan:31005/nginx-plus-with-agent:2.7.0 in the sample commands below)

    • ‑n – Base URL of your NGINX Management Suite instance (https://nim.f5.ff.lan in the sample commands below)

    The additional options are:

    • ‑d – Add data‑plane support for the developer portal when using NGINX API Connectivity Manager
    • ‑w – Add NGINX App Protect WAF

    Here are the commands for the different combinations of software:

    • NGINX Plus and NGINX Agent:

      $ ./scripts/build.sh -C nginx-repo.crt -K nginx-repo.key \
      -t registry.ff.lan:31005/nginx-plus-with-agent:2.7.0 \
      -n https://nim.f5.ff.lan
    • NGINX Plus, NGINX Agent, and NGINX App Protect WAF (add the ‑w option):

      $ ./scripts/build.sh -C nginx-repo.crt -K nginx-repo.key \
      -t registry.ff.lan:31005/nginx-plus-with-agent:2.7.0 -w \
      -n https://nim.f5.ff.lan
    • NGINX Plus, NGINX Agent, and developer portal support (add the ‑d option):

      $ ./scripts/build.sh -C nginx-repo.crt -K nginx-repo.key \ 
      -t registry.ff.lan:31005/nginx-plus-with-agent:2.7.0 -d \ 
      -n https://nim.f5.ff.lan

    Here’s a sample trace of the build for a basic image. The Build complete message at the end indicates a successful build.

    $ ./scripts/build.sh -C nginx-repo.crt -K nginx-repo.key -t registry.ff.lan:31005/nginx-plus-with-agent:2.7.0 -n https://nim.f5.ff.lan 
    => Target docker image is nginx-plus-with-agent:2.7.0 
    [+] Building 415.1s (10/10) FINISHED 
    => [internal] load build definition from Dockerfile
    => transferring dockerfile: 38B
    => [internal] load .dockerignore 
    => transferring context: 2B 
    => [internal] load metadata for docker.io/library/centos:7
    => [auth] library/centos:pull token for registry-1.docker.io
    => CACHED [1/4] FROM docker.io/library /centos:7@sha256:be65f488b7764ad3638f236b7b515b3678369a5124c47b8d32916d6487418ea4
    => [internal] load build context 
    => transferring context: 69B 
    => [2/4] RUN yum -y update  && yum install -y wget ca-certificates epel-release curl  && mkdir -p /deployment /etc/ssl/nginx  && bash -c 'curl -k $NMS_URL/install/nginx-agent | sh' && echo "A  299.1s 
    => [3/4] COPY ./container/start.sh /deployment/
    => [4/4] RUN --mount=type=secret,id=nginx-crt,dst=/etc/ssl/nginx/nginx-repo.crt  --mount=type=secret,id=nginx-key,dst=/etc/ssl/nginx/nginx-repo.key  set -x  && chmod +x /deployment/start.sh &  102.4s  
    => exporting to image 
    => exporting layers 
    => writing image sha256:9246de4af659596a290b078e6443a19b8988ca77f36ab90af3b67c03d27068ff 
    => naming to registry.ff.lan:31005/nginx-plus-with-agent:2.7.0 
    => Build complete for registry.ff.lan:31005/nginx-plus-with-agent:2.7.0

    Running the Docker Image in Kubernetes

    Follow these instructions to prepare the Deployment manifest and start NGINX Plus with NGINX Agent on Kubernetes.

    1. Using your preferred text editor, open manifests/1.nginx-with-agent.yaml and make the following changes (the code snippets show the default values that you can or must change, highlighted in orange):

      • In the spec.template.spec.containers section, replace the default image name (your.registry.tld/nginx-with-nim2-agent:tag) with the Docker image name you specified with the ‑t option in Step 3 of Building the Docker Image (in our case, registry.ff.lan:31005/nginx-plus-with-agent:2.7.0):

        spec:
          ...
          template:
            ...    
            spec:
              containers:
              - name: nginx-nim
                image: your.registry.tld/nginx-with-nim2-agent:tag
      • In the spec.template.spec.containers.env section, make these substitutions in the value field for each indicated name:

        • NIM_HOST – (Required) Replace the default (nginx-nim2.nginx-nim2) with the FQDN or IP address of your NGINX Management Suite instance (in our case nim2.f5.ff.lan).
        • NIM_GRPC_PORT – (Optional) Replace the default (443) with a different port number for gRPC traffic.
        • NIM_INSTANCEGROUP – (Optional) Replace the default (lab) with the instance group to which the NGINX Plus instance belongs.
        • NIM_TAGS – (Optional) Replace the default (preprod,devops) with a comma‑delimited list of tags for the NGINX Plus instance.
        spec:
          ...
          template:
            ...    
          spec:
            containers:
              ...
              env:
                - name: NIM_HOST
                ...
                  value: "nginx-nim2.nginx-nim2"
                - name: NIM_GRPC_PORT
                  value: "443"
                - name: NIM_INSTANCEGROUP
                  value: "lab"
                - name: NIM_TAGS
                  value: "preprod,devops"
      • Also in the spec.template.spec.containers.env section, uncomment these namevalue field pairs if the indicated condition applies:

        • NIM_WAF and NIM_WAF_PRECOMPILED_POLICIES – NGINX App Protect WAF is included in the image (you included the -w option in Step 3 of Building the Docker Image), so the value is "true".
        • ACM_DEVPORTAL – Support for the App Connectivity Manager developer portal is included in the image (you included the -d option in Step 3 of Building the Docker Image), so the value is "true".
        spec:
          ...
          template:
            ...    
          spec:
            containers:
              ...
              env:
                - name: NIM_HOST
                ...
                #- name: NAP_WAF
                #  value: "true"
                #- name: NAP_WAF_PRECOMPILED_POLICIES
                #  value: "true"
                ...
                #- name: ACM_DEVPORTAL
                #  value: "true"
    2. Run the nginxwithAgentStart.sh script as indicated to apply the manifest and start two pods (as specified by the replicas: 2 instruction in the spec section of the manifest), each with NGINX Plus and NGINX Agent:

      $ ./scripts/nginxWithAgentStart.sh start
      $ ./scripts/nginxWithAgentStart.sh stop
    3. Verify that two pods are now running: each pod runs an NGINX Plus instance and an NGINX Agent to communicate with the NGINX Management Suite control plane.

      $ kubectl get pods -n nim-test  
      NAME                        READY  STATUS   RESTARTS  AGE 
      nginx-nim-7f77c8bdc9-hkkck  1/1    Running  0         1m 
      nginx-nim-7f77c8bdc9-p2s94  1/1    Running  0         1m
    4. Access the NGINX Instance Manager GUI in NGINX Management Suite and verify that two NGINX Plus instances are running with status Online. In this example, NGINX App Protect WAF is not enabled.

      Screenshot of Instances Overview window in NGINX Management Suite Instance Manager version 2.7.0

    Get Started

    To try out the NGINX solutions discussed in this post, start a 30-day free trial today or contact us to discuss your use cases:

    Download NGINX Agent – it’s free and open source.

Active or Passive Health Checks: Which Is Right for You?

Just as regular check‑ups with a doctor are an important part of staying healthy, regular checks on the health of your apps are critical for reliable performance. When reverse proxying and load balancing traffic, NGINX uses passive health checks to shield your application users from outages by automatically diverting traffic away from servers that don’t respond to requests. NGINX Plus adds active health checks, sending special probes that can detect unhealthy servers even before they fail to process a request. Which type of health check makes sense for your applications? In this post, we give you the info you need to make that decision.

What Is a Health Check?

In the most basic sense, a health check is a method for determining whether a server is able to handle traffic. NGINX uses health checks to monitor the servers for which it is reverse proxying or load balancing traffic – what it calls upstream servers.

Passive Health Checks

Passive health checks – available in both NGINX Open Source and NGINX Plus – rely on observing how the server behaves while handling connections and traffic. They help prevent users from experiencing outages due to server timeouts, because when NGINX discovers a server is unhealthy it immediately forwards the request to a different server, stops sending requests to the unhealthy server, and distributes future requests among the remaining healthy servers in the upstream group.

Note that passive health checks are effective only when the upstream group is defined to have multiple members. When only one upstream server is defined, it is never marked unavailable and users see an outage when it’s unhealthy.

How Passive Health Checks Work

Here’s a detailed look at how passive health checks work, but skip ahead to Active Health Checks if it’s not of interest.

By default, NGINX considers a TCP/UDP (stream) server unhealthy if there is a single error or timeout while establishing a connection with it.

NGINX considers an HTTP server unhealthy if there is a single error or timeout while establishing a connection with it, passing a request to it, or reading the response header (receiving no response at all counts as this type of error). You can use the proxy_next_upstream directive to customize these conditions for HTTP proxying, and there is a parallel directive for the FastCGI, gRPC, memcached, SCGI, TCP/UDP, and uwsgi protocols.

For both HTTP and TCP/UDP, NGINX waits a default ten seconds before again trying to connect and send a request to an unhealthy server. You can use the fail_timeout parameter to the server[HTTP][Stream] directive to change this amount of time.

You can use the max_fails parameter to the server directive to increase the number of errors or timeouts that must occur for NGINX to consider the server unhealthy; in this case, the fail_timeout parameter sets the period during which that number of errors or timeouts must occur, as well as how long NGINX waits to try the server again after marking it unhealthy.

Active Health Checks

Active health checks – which are exclusive to NGINX Plus – are special requests that are regularly sent to application endpoints to make sure they are responding correctly. They are separate from and in addition to passive health checks. For example, NGINX Plus might send a periodic HTTP request to the application’s web server to ensure it responds with a valid response code and the correct content. Active health checks enable continuous monitoring of the health of specific application components and processes. It constitutes a direct measurement of application availability, although that depends on how representative the specified health check is of overall application health.

You can customize many aspects of an active health check; see Use Cases for Active Health Checks.

Diagram showing types of traffic NGINX Open Source and NGINX Plus used for passive and active health checks

Use Cases for Passive Health Checks

Passive health checks are table stakes. It’s a best practice for every Application Development, DevOps, DevSecOps, and Platform Ops team to run passive health checks as a part of its monitoring program for production infrastructure. NGINX runs passive health checks on load‑balanced traffic by default, including HTTP, TCP, and UDP configurations.

The advantages of passive health checks include:

  • Available in NGINX Open Source
  • Enabled by default for the servers included in an upstream{} configuration block
  • No additional load on the upstream servers
  • Configurable in terms of minimum number of failures within a time period, as described in How Passive Health Checks Work
  • Configurable slow start (exclusive to NGINX Plus) – when a server returns to health, NGINX Plus gradually ramps up the amount of traffic forwarded to it, to give it time to “warm up”

The advantages of NGINX Open Source are cost (none, obviously), configurability, and a vast library of third‑party modules. Because the source code is available, developers can modify and extend the functionality to suit their specific needs.

For many applications (and their developers) passive health checks are sufficient. For example, active health checks might be overkill for microservices that are not facing customers and perform smaller tasks. Similarly, they may not be necessary for applications where caching can reduce chances of latency issues or content distribution networks (CDNs) can take over some of the application tasks. To summarize, passive health checks alone are best for:

  • Monitoring HTTP traffic
  • Monitoring infrastructure separately from applications
  • Monitoring applications where latency is tolerable
  • Monitoring internal applications where high performance isn’t important

Use Cases for Active Health Checks

For mission‑critical applications, active health checks are often crucial because customers and key processes are directly impacted by problems. With these applications, it is critical to test the application essentially as the customer or consumer of the application does, and that requires active health checks. Active health checks are similar to application performance monitoring tools such as New Relic and AppDynamics, which use out-of-band checks to measure application latency and responses. For active health checks, NGINX Plus includes a number of features and capabilities not included in NGINX Open Source:

  • Out-of-band health checks for application availability
  • Test configured end points and look for specific responses
  • Test different ports than those handling real application traffic
  • Keepalive HTTP connections for health checks, eliminating the need to set up a new connection for each check
  • Greater control over failing and passing conditions
  • Optionally test any newly added servers before they receive real application traffic

With active health checks, developers can set up NGINX Plus to automatically detect when a backend server is down or experiencing issues, then route traffic to healthy servers until the issue is fixed. The greater configurability of active health checks allows for more sophisticated health checks to be performed, possibly detecting application problems before they impact real application users. This can minimize downtime and prevent interruptions to user access to the application.

How to Configure Health Checks

Passive health checks are enabled by default, but you can customize their frequency and the number of failures that occur before a service is marked unhealthy, as described in How Passive Health Checks Work. For complete configuration instructions for both passive and active health checks, see our documentation:

Conclusion: Pick the Health Checks that Match Your Application Requirements

Health checks are an important part of keeping any production application running smoothly and responsively. They are the best way to detect problems and identify growing sources of latency before they affect end users. For many applications, passive health checks are sufficient.

For more critical applications, where direct insights into application behaviors at the user level are necessary, active checks are better. NGINX Open Source is free to use and provides configurable passive health checks. NGINX Plus provides advanced active health check capabilities as well as commercial support.

Want to try active health checks with NGINX Plus? Start your 30-day free trial today or contact us to discuss your use cases.